Deskripsi
📈 pATR – Percentile Average True Range
Volatilitas Presisi. Risiko Lebih Cerdas. Keunggulan Institusional.
Indikator pATR mendefinisikan ulang ATR tradisional dengan menerapkan filter berbasis persentil pada nilai true range terbaru, memberikan trader pandangan volatilitas yang didasarkan secara statistik. Alih-alih mengandalkan rata-rata sederhana, pATR menghitung persentil ke-n dari intensitas pergerakan harga terbaru — membantu Anda mengidentifikasi zona breakout, setup fade, dan ambang risiko dengan akurasi bedah.
Apakah Anda sedang menghadapi tantangan prop firm atau menyempurnakan strategi scalping, pATR memberikan tolok ukur volatilitas dinamis yang beradaptasi dengan kondisi pasar dan menjaga risiko Anda tetap terkalibrasi.
🔍 Fitur Utama
• ATR Berbasis Persentil: Menyaring noise dan kejadian ekor untuk sinyal volatilitas yang lebih bersih
• Logika Buffer Sirkular: Dioptimalkan untuk kecepatan dan efisiensi memori — tanpa lag, tanpa kekacauan
• Siap Mode Tantangan: Ideal untuk trader prop firm yang mengelola drawdown dan batas perdagangan
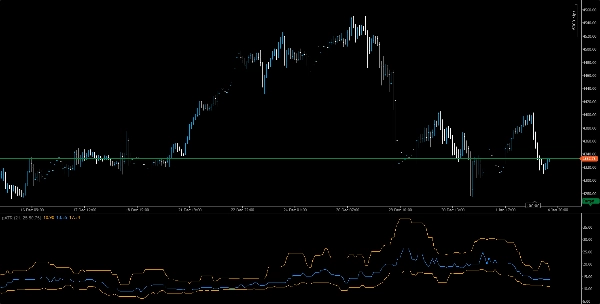
• Visual Bersih: Garis volatilitas oranye dengan opsi skala dan overlay yang intuitif
• Kompatibel Multi-Timeframe: Gunakan di M1 hingga H1 untuk setup breakout, fade, atau tren
🧠 Kasus Penggunaan
• Konfirmasi Breakout: Gunakan lonjakan pATR untuk memvalidasi entri momentum
• Kalibrasi Risiko: Sesuaikan stop-loss dan ukuran posisi dengan volatilitas persentil
• Backtesting Strategi: Validasi setup dengan ambang volatilitas yang konsisten
🎯 Untuk Siapa Ini
• Trader prop firm yang mencari kontrol risiko berbasis aturan
• Scalper dan ahli strategi intraday yang membutuhkan filter volatilitas adaptif
• Trader kuantitatif yang mengintegrasikan logika persentil ke dalam sistem kustom
• Pendidik dan mentor yang mengajarkan eksekusi yang sadar volatilitas
Ringkasan
Key features include an orange volatility line with intuitive scaling and overlay options, compatibility across multiple timeframes from 1-minute to 1-hour charts, and suitability for prop firm traders managing drawdowns and trade limits. pATR helps traders identify breakout zones, fade setups, and risk thresholds with precision.
Use cases cover breakout confirmation through volatility spikes, risk calibration by aligning stop-loss and position sizing with percentile volatility, and strategy backtesting using consistent volatility benchmarks. The indicator is designed for prop firm traders, scalpers, intraday strategists, quantitative traders integrating percentile logic, and educators focusing on volatility-aware execution.
Supported markets include Forex, stocks, indices, commodities, and cryptocurrencies, making pATR a versatile tool for various trading environments.


![Logo "[Stellar Strategies] Inside Bar with Signals"](https://cdn.ctrader.com/image/webp/1d9e8bfa-3b2c-4440-bb37-5856902008a7_30683)