
Deskripsi
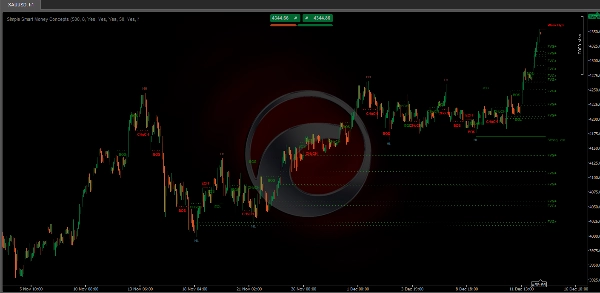
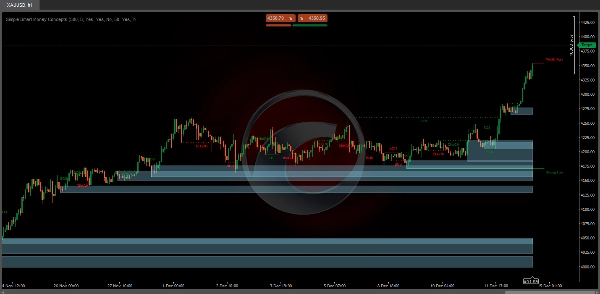
Indikator Simple Smart Money Concepts ini menampilkan struktur pasar waktu nyata (internal & swing BOS / CHoCH), blok order, zona premium & diskon, puncak & lembah yang sama, dan banyak lagi... memungkinkan trader secara otomatis menandai grafik mereka dengan metodologi aksi harga yang banyak digunakan.
"Smart Money Concepts" (SMC) adalah istilah yang digunakan di antara trader aksi harga yang ingin menavigasi likuiditas dengan lebih akurat & menemukan titik minat yang lebih optimal di pasar. Mencoba menentukan di mana peserta pasar institusional menempatkan order bisa menjadi pendekatan yang sangat masuk akal untuk menemukan entri & keluar yang lebih praktis berdasarkan aksi harga.
Fitur Utama
- Struktur pasar Internal dan Swing secara waktu nyata:
-
- Struktur Internal: Elemen-elemen ini merujuk pada formasi dan pola harga yang terjadi dalam lingkup yang lebih kecil atau sesi perdagangan tertentu. Suite ini dapat mendeteksi detail rumit seperti level support/resistance minor atau pembalikan tren jangka pendek.
- Struktur Eksternal: Ini melibatkan pola dan tren pasar yang lebih besar dan signifikan yang mencakup beberapa sesi atau kerangka waktu. Kemampuan ini membantu trader memahami arah pasar secara menyeluruh.
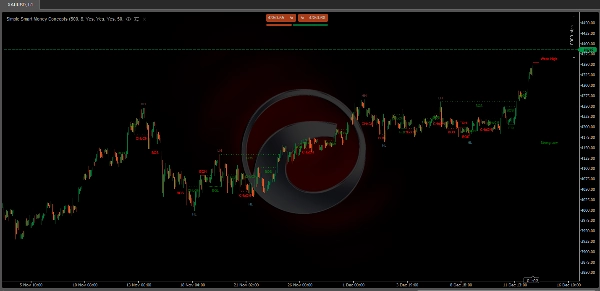
- Area HH/LH/LL/LH:
-
- Mengidentifikasi Higher Highs (HH), Lower Highs (LH), Lower Lows (LL), dan Lower Highs (LH) membantu dalam memahami tren dan struktur pasar, mendukung analisis prediktif.
- Break of Structure (BOS):
-
- Fitur ini mengidentifikasi titik di mana harga menembus struktur signifikan, yang berpotensi menunjukkan tren baru atau pembalikan tren.
- Change of Character (CHoCH):
-
- Mendeteksi pergeseran halus dalam perilaku pasar, yang bisa menunjukkan tahap awal perubahan tren sebelum menjadi jelas bagi pasar yang lebih luas.
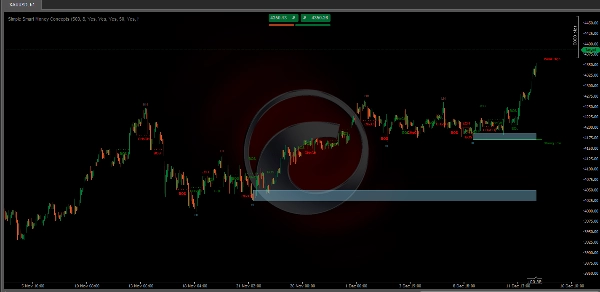
- Order Blocks:
-
- Ini pada dasarnya adalah level harga atau zona di mana aktivitas perdagangan signifikan sebelumnya terjadi, kemungkinan menunjukkan posisi smart money.
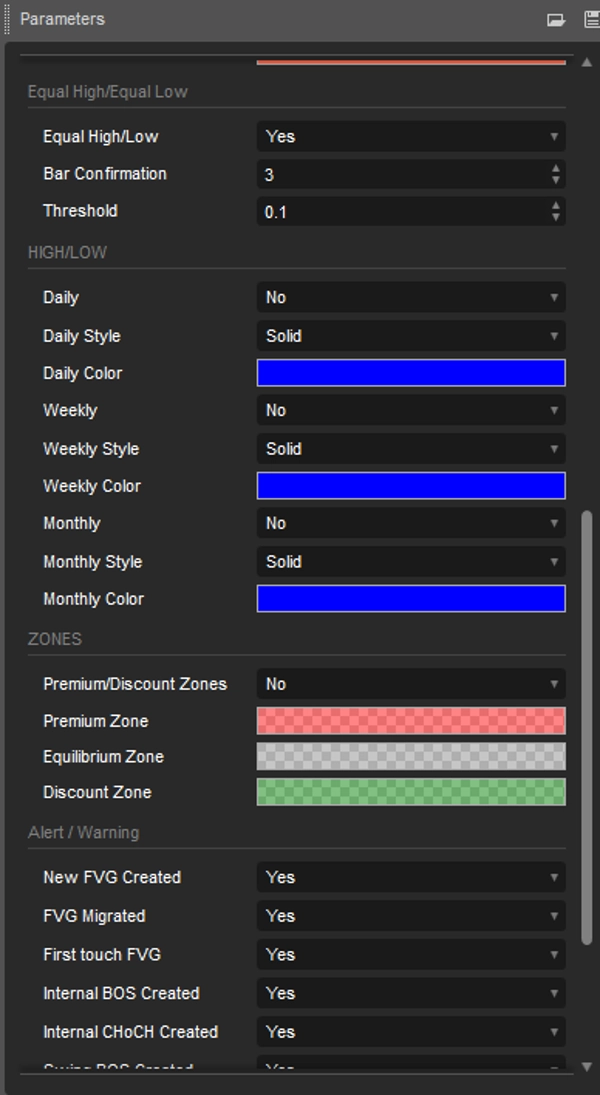
- Equal Highs and Lows
-
- Menampilkan label EQH/EQL pada grafik untuk mendeteksi puncak & lembah yang sama.
- Fair Value Gaps:
-
- Fair Value Gaps: Formasi tiga lilin di mana bayangan lilin yang berdekatan dengan lilin tengah tidak tumpang tindih, ini menyoroti area celah.
- Previous Highs & Lows:
-
- Memungkinkan pengguna menampilkan puncak & lembah sebelumnya dari kerangka waktu harian, mingguan, & bulanan sebagai level signifikan
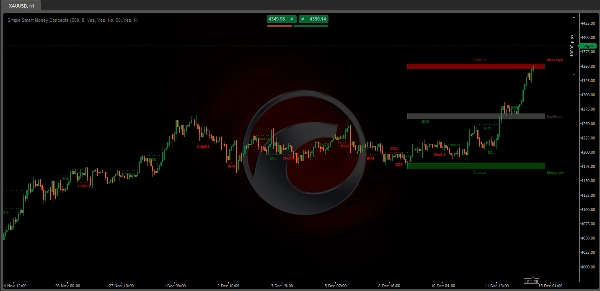
- Premium & Discount Zones sebagai rentang:
-
- Memungkinkan pengguna menampilkan zona Premium, Diskon, dan Keseimbangan pada grafik
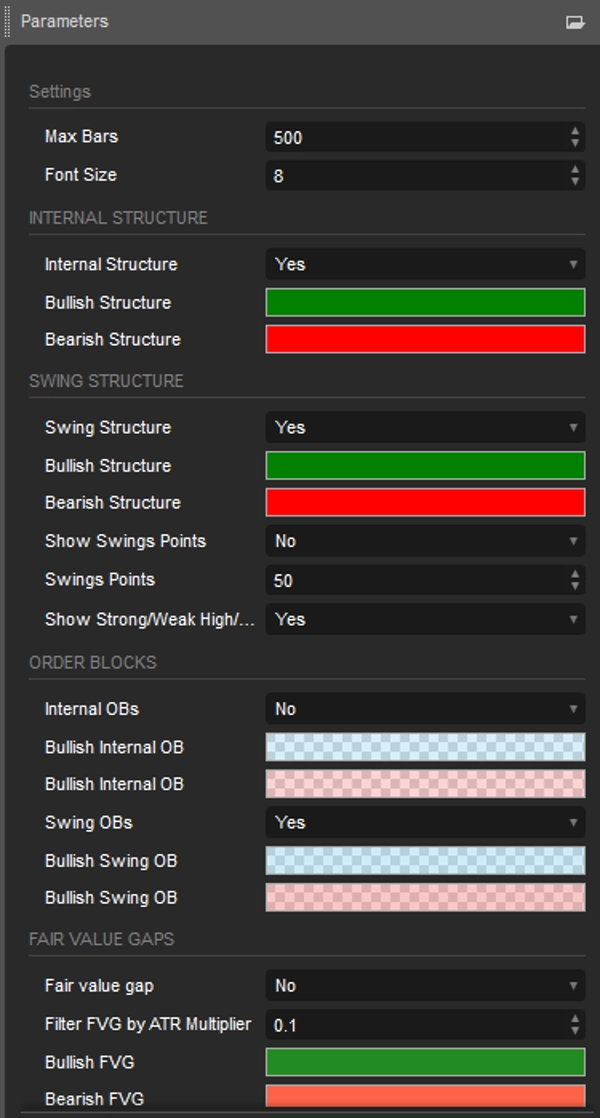
Fitur yang Dapat Disesuaikan
- Pengguna dapat menyesuaikan pengaturan seperti panjang data, warna, dan gaya tampilan agar sesuai dengan preferensi trading mereka.
Manfaat untuk Trader
- Menghemat waktu pada analisis manual, meningkatkan efisiensi trading.
- Membantu membuat keputusan cepat dan tepat selama kondisi pasar yang volatil.
- Mudah digunakan untuk pemula maupun trader berpengalaman.
Kesimpulan
Indikator Simple Smart Money Concepts bukan hanya alat tetapi solusi komprehensif bagi trader yang ingin secara efektif menerapkan strategi ICT. Ini adalah pilihan yang kuat untuk meningkatkan analisis pasar dan mengeksekusi perdagangan yang tepat.
Ringkasan
Additional features include the identification of equal highs and lows, fair value gaps (three-candle formations indicating price gaps), and previous highs and lows across daily, weekly, and monthly timeframes. It also displays premium, discount, and equilibrium zones to help traders assess value areas.
Users can customize settings such as data length, colors, and display styles to fit their trading preferences. The indicator supports analysis across multiple markets including Forex, cryptocurrencies (e.g., BTCUSD), stocks, and commodities (e.g., XAUUSD).
Designed to streamline chart analysis, the Simple Smart Money Concepts indicator aids traders in making informed decisions by visually representing widely used price action methodologies and institutional order flow concepts.
Ulasan pelanggan
5 | 33 % | |
4 | 67 % | |
3 | 0 % | |
2 | 0 % | |
1 | 0 % |


![Logo "[Hamster-Coder] Pivot Points MTF"](https://cdn.ctrader.com/image/webp/4c143e5a-309c-40e3-a578-f04d1e133ffa_31159)


