
FairValueGap-PremiumVersion1
指标
8 购买
版本 1.0, Apr 2025
Windows 版、Mac 版
5.0
评价:1
说明
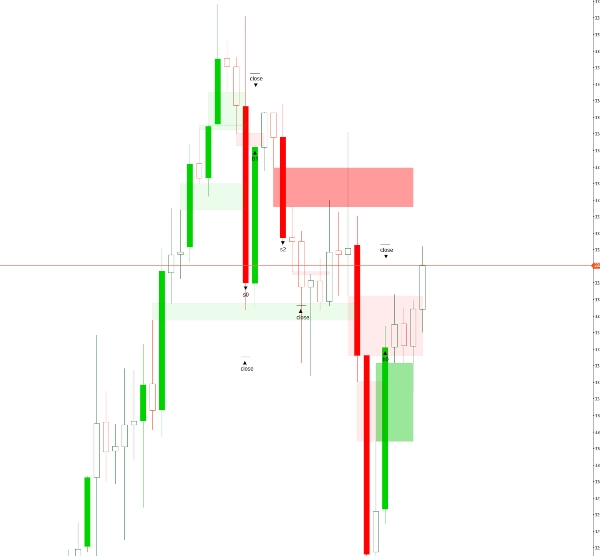
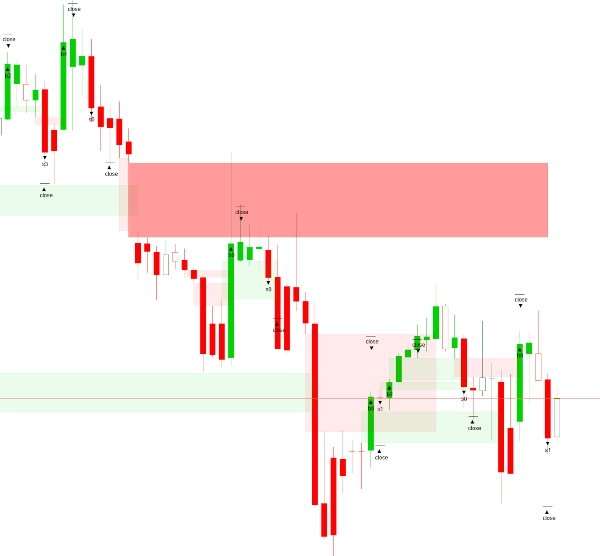
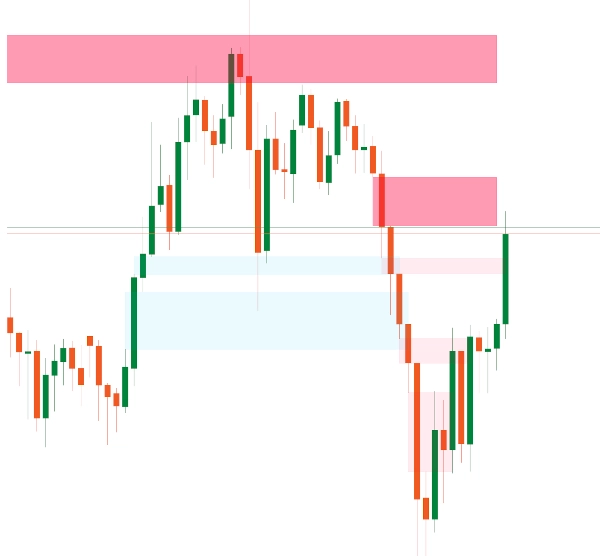
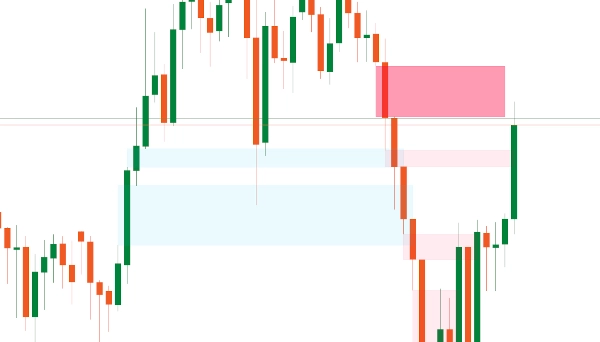
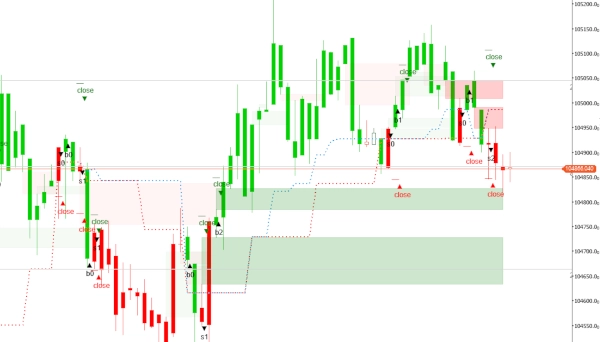
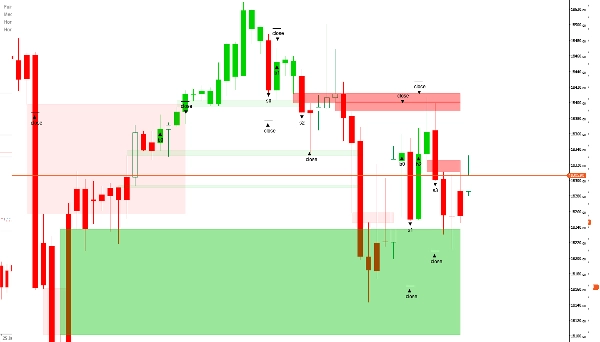
此公平价值缺口(FVG)指标是一种技术分析工具,旨在检测金融市场中的价格低效区域。它识别价格快速上涨或下跌后留下的“缺口”——一个几乎没有交易活动的区域。这些缺口通常表明供需暂时失衡,暗示价格可能最终回补该空白区域,以实现市场平衡。通常,当一根价格蜡烛线收盘价显著高于或低于前一根蜡烛线的最高价或最低价且无重叠时,即被认定为FVG,表明潜在的反应区域。这种行为通常与机构交易或算法活动相关。虽然大多数版本的该指标仅分析单一时间框架内的不平衡,但高级版本通过直接在当前图表上检测并显示来自更高或更低时间框架的缺口,增加了多时间框架分析的深度和灵活性。
设置概览
- 加载的K线数量:指定要分析的历史K线数量,从最近完成的K线开始,向前推算。
- 看涨FVG颜色:设置出现在上涨趋势中的FVG颜色。应用30%的透明度,以便缺口后面的元素仍然可见。
- 看跌FVG颜色:设置出现在下跌趋势中的FVG颜色,同样应用30%的透明度以增强图表可视性。
高级功能(付费版本提供)
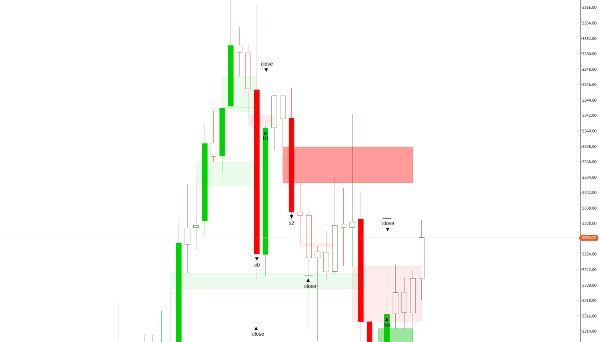
- 删除已关闭的缺口:布尔设置——启用(“是”)时自动删除所有已关闭的缺口;禁用(“否”)时缺口保持可见。此功能在低时间框架(20分钟以下)特别有用。
- 编辑/删除缺口:允许交易者手动调整或删除缺口。这为有经验的交易者提供了更大的控制权,尤其是因为非常小的缺口通常对价格走势影响有限。
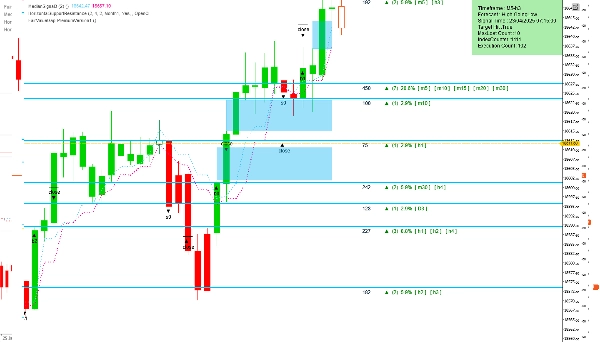
- 设置时间框架:提供两个选项——使用当前图表的时间框架或选择不同的时间框架进行分析,同时仍在主图表上显示结果。此功能帮助交易者更快地洞察可能的市场走势。
- 选择的时间框架:如果上述设置中选择了“选择的时间框架”,则指定所需的分析时间框架。
- 小缺口精度:允许交易者输入首选的缺口大小(整数),帮助识别历史上带来有利结果的缺口。该值基于整个数据集和资产观察到的缺口大小。
默认情况下,指标扫描单一时间框架内的所有不平衡。然而,通过FairValueGapPremium版本访问高级功能,可以大大增强分析能力。
摘要
AI 摘要
The FairValueGap-PremiumVersion1 is a technical analysis indicator designed to identify Fair Value Gaps (FVGs) in financial markets. An FVG represents a price gap created when a candle closes significantly above or below the previous candle without overlap, indicating a potential imbalance in supply and demand. These gaps often arise from rapid price movements and are associated with institutional or algorithmic trading, suggesting areas where price may return to fill the gap.
This indicator detects such gaps to highlight potential reaction zones. By default, it analyzes imbalances within a single timeframe. The premium version enhances functionality by allowing detection and display of FVGs from higher or lower timeframes directly on the current chart, supporting multi-timeframe analysis.
Key settings include the number of historical bars to analyze and customizable colors for bullish and bearish gaps with transparency for chart clarity. Premium features offer options to automatically delete closed gaps, manually edit or remove gaps, select analysis timeframes independent of the chart’s timeframe, and specify gap size accuracy to focus on significant gaps.
This tool aids traders in identifying price inefficiencies and probable market reaction areas through detailed gap analysis across multiple timeframes.
指标配置
客户评价
5.0
评价:1
5 | 100 % | |
4 | 0 % | |
3 | 0 % | |
2 | 0 % | |
1 | 0 % |
客户评价
May 4, 2025
Win rate means less without average R. It makes overtrading easier to notice.
讨论
常见问答
Signal
cTrader Store 提供的所有产品,包括交易机器人、指标和插件,均由第三方开发者提供,仅供信息参考和技术访问之用。cTrader Store 并非经纪商,不提供投资建议、个人推荐或任何未来业绩保证。


猜您喜欢


!["Gaussian Channel [Iridio Capital]" 标识](https://cdn.ctrader.com/image/webp/7c039209-5573-4a54-a072-f9528b503103_41960)


价格
注册日期 19/04/2025
284.21M
交易量
1.08M
盈利点数
8
销售
3.46K
免费安装