
BarSentiments
指标
532 下载
版本 1.0, Apr 2025
Windows 版、Mac 版
5.0
评价:2
说明
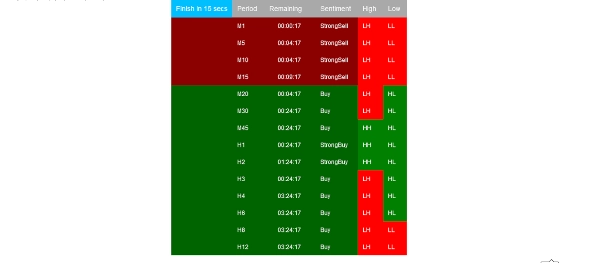
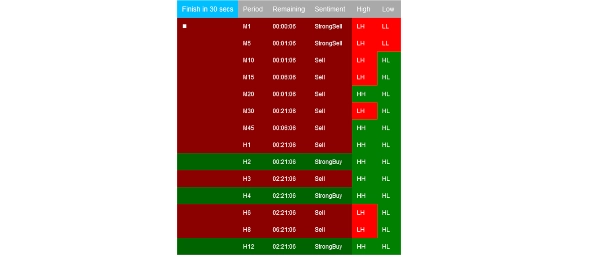
此柱状情绪图指标是一种技术分析工具,用于逐柱(或逐烛)衡量市场情绪的强度和方向。它通过分析每根柱的开盘价、最高价、最低价和收盘价之间的关系,判断该时间段内市场表现出的是看涨、看跌还是中性行为。
通常,当收盘价显著高于开盘价,表明强烈的买入压力时,识别为看涨情绪。当收盘价明显低于开盘价,显示强烈的卖出压力时,检测为看跌情绪。中性柱,通常称为“十字星”,反映买卖双方的犹豫或平衡。
高级版本的柱状情绪指标可能会结合成交量、相对实体大小或动量等额外因素,以细化情绪分类。情绪通常通过颜色编码来可视化——绿色代表看涨,红色代表看跌,灰色或蓝色代表中性——使得快速评估当前市场氛围变得容易。
如果说1和0是软件工程的构建基石,那么柱状情绪图指标的输出则代表了高级机器学习交易系统的基本构建模块。通过量化原始市场情绪,它为旨在基于历史行为学习和预测未来价格走势的算法提供了关键输入。
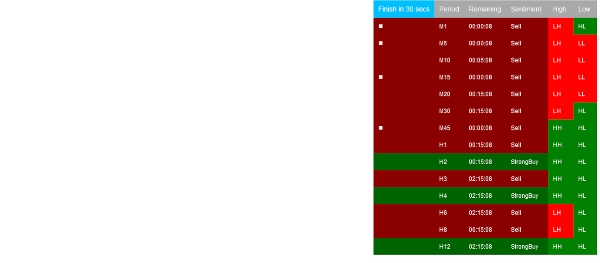
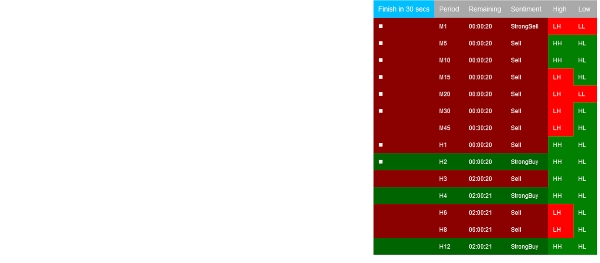
使用柱状情绪图指标,交易者能够更深入地理解微观市场动态,帮助他们识别趋势强度、潜在反转和盘整期——尤其是在结合多时间框架分析和其他技术工具时。
摘要
AI 摘要
The BarSentiments Chart Indicator is a technical analysis tool that evaluates market sentiment on a bar-by-bar or candlestick basis. It analyzes each bar’s open, high, low, and close prices to classify market behavior as bullish, bearish, or neutral. Bullish sentiment is identified when the close price is significantly higher than the open, indicating buying pressure. Bearish sentiment occurs when the close is notably lower than the open, signaling selling pressure. Neutral bars, often called dojis, represent market indecision or balance between buyers and sellers.
Advanced versions may integrate factors like volume, relative body size, or momentum to enhance sentiment accuracy. The indicator typically uses color-coding—green for bullish, red for bearish, and gray or blue for neutral—to visually represent market tone. By quantifying raw market sentiment, it provides foundational data useful for machine learning trading systems aiming to predict future price movements.
Traders can use this indicator to gain insight into micro market dynamics, helping to identify trend strength, potential reversals, and consolidation phases. It is particularly effective when combined with multi-timeframe analysis and other technical tools.
指标配置
客户评价
5.0
评价:2
5 | 100 % | |
4 | 0 % | |
3 | 0 % | |
2 | 0 % | |
1 | 0 % |
客户评价
August 18, 2025
Pros: Simple and effective bar sentiment visualization. Lightweight and works on all timeframes. Useful for scalping and intraday trading. Cons: No alerts, MTF mode, or preset saving. Limited integration with other tools.
July 8, 2025
Great Tool Nardo. It would be great to have this same graphic visualisation in a cTrader plugin, in orden to free chart space and having the table on the side (right column of the platform, under the New Order section)
讨论
常见问答
AI
cTrader Store 提供的所有产品,包括交易机器人、指标和插件,均由第三方开发者提供,仅供信息参考和技术访问之用。cTrader Store 并非经纪商,不提供投资建议、个人推荐或任何未来业绩保证。
该作者的其他作品


猜您喜欢


价格
注册日期 19/04/2025
284.21M
交易量
1.08M
盈利点数
8
销售
3.46K
免费安装