


说明
价格变动组合包 — 3个指标,1套逻辑。
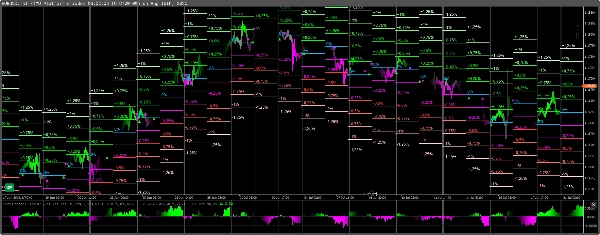
来自我个人设置的工具(供需 + 自定义ZigZag)。旨在展示价格如何围绕更高时间框架的收盘价真实波动。
切换任意模块开/关 — 启用/禁用 水平线, 柱状图, 直方图 单独操作。
模块
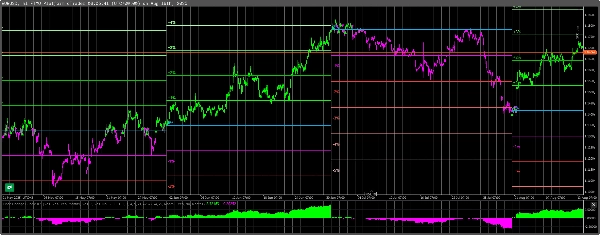
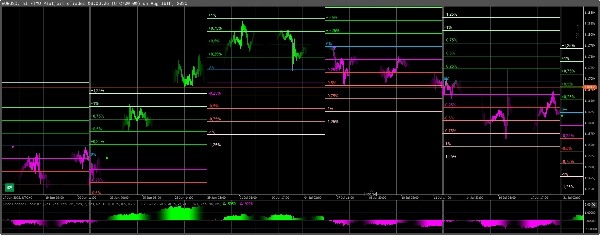
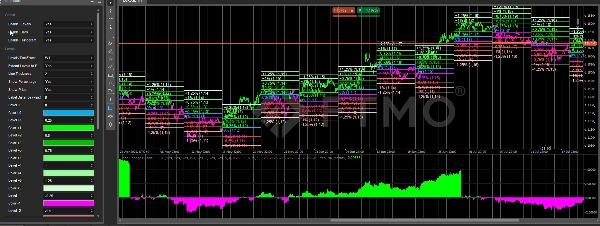
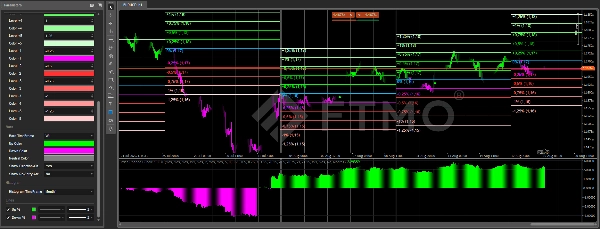
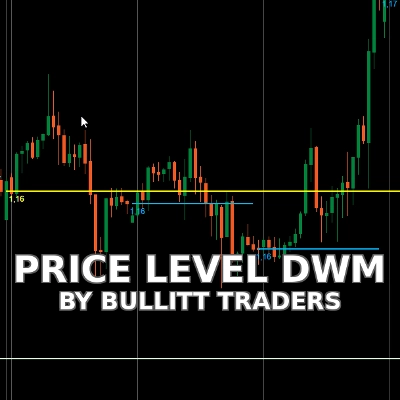
价格变动水平线
- 绘制 百分比区域 (±0.25…±1.25%) 在所选时间框架内。
- 每个区域均从 0%基线 测量,并显示 百分比和价格。
- 可选择 将线条延伸至周期末尾,以获得清晰的周/月图。
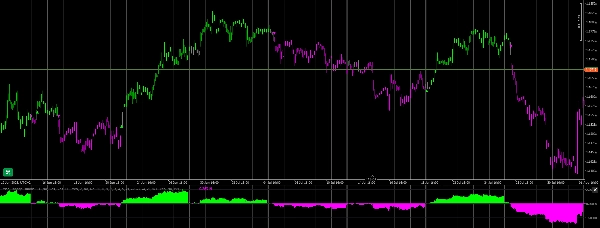
价格变动柱状图
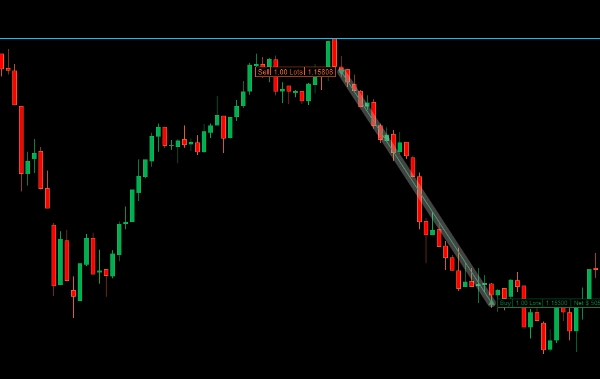
- 根据 完全高于/低于 模式相对于时间框架枢轴点为蜡烛着色。
- 最佳用于柱关闭时 进行入场和快速读取模式。
- 包含 方向变化 和 重新入场 箭头(中立→同侧后)。
价格变动直方图
- 显示 整体百分比变化 相对于相同时间框架参考(上涨% / 下跌%)。
- 非常适合一目了然地发现 加速/减速。
为什么有效 — “价格运动的秘密”
- 专业人士锚定于 更高时间框架的前期收盘价(月线/周线/日线)。
- 从该锚点测量的 百分比距离 如同实用的 磁铁/目标。
- 完全 高于/低于 枢轴点的蜡烛定义了 模式; 中立后重新入场 通常会继续走势。
灵活使用
- 每个模块可选择任意时间框架(例如,月线水平线 • 周线柱状图 • 日线直方图)。
- 适用于任何图表类型,包括 Renko/区间/滴答图(计算使用您选择的 基于时间的时间框架)。
- 无重绘。轻量级。
视频与支持
- 一段 逐步视频(安装、预设、交易示例)将会 很快 发布。
- 买家可直接联系我,咨询任何问题、设置帮助或反馈。我会亲自回复。
摘要
AI summary
Price Change Bundle 1.0 BT is a composite indicator consisting of three modules—Levels, Bars, and Histogram—designed to analyze price movements relative to higher timeframe closes. It integrates concepts from Supply & Demand and a custom ZigZag to reveal how price behaves around significant reference points.
- Price Change Levels: Displays percentage zones (±0.25% to ±1.25%) from a 0% baseline within a selected timeframe, showing both percentage and price values. Lines can be extended to the period’s end for clear weekly or monthly mapping.
- Price Change Bars: Colors candles based on their position relative to the timeframe pivot, indicating regimes with full above/below coloring. Includes arrows signaling direction changes and re-entries after neutral phases, aiding entry decisions.
- Price Change Histogram: Illustrates overall percentage development (Up%/Down%) against the same timeframe reference, facilitating quick identification of acceleration or slowdowns.
Each module can be toggled on or off independently and configured with different timeframes. The indicator works on any chart type, including Renko, range, and tick charts, using time-based timeframe calculations. It anchors calculations to previous closes of higher timeframes (monthly, weekly, daily) and does not repaint. Buyers have access to direct support from the developer.
- Price Change Levels: Displays percentage zones (±0.25% to ±1.25%) from a 0% baseline within a selected timeframe, showing both percentage and price values. Lines can be extended to the period’s end for clear weekly or monthly mapping.
- Price Change Bars: Colors candles based on their position relative to the timeframe pivot, indicating regimes with full above/below coloring. Includes arrows signaling direction changes and re-entries after neutral phases, aiding entry decisions.
- Price Change Histogram: Illustrates overall percentage development (Up%/Down%) against the same timeframe reference, facilitating quick identification of acceleration or slowdowns.
Each module can be toggled on or off independently and configured with different timeframes. The indicator works on any chart type, including Renko, range, and tick charts, using time-based timeframe calculations. It anchors calculations to previous closes of higher timeframes (monthly, weekly, daily) and does not repaint. Buyers have access to direct support from the developer.
指标配置
客户评价
4.0
评价:1
5 | 0 % | |
4 | 100 % | |
3 | 0 % | |
2 | 0 % | |
1 | 0 % |
客户评价
February 9, 2026
Price Change Bundle 1.0 BT delivers clear and practical price-change metrics. Best used on M10-H1, where momentum readings stay balanced and meaningful. Great for filtering weak moves, confirming impulse strength and improving intraday timing. A simple but effective companion for momentum-based strategies.
讨论
常见问答
Prop
Forex
Signal
Breakout
Indices
cTrader Store 提供的所有产品,包括交易机器人、指标和插件,均由第三方开发者提供,仅供信息参考和技术访问之用。cTrader Store 并非经纪商,不提供投资建议、个人推荐或任何未来业绩保证。


























价格
51
销售
1.43K
免费安装