


Description
Unix Scalper
Multi-timeframe trend and momentum analysis for cTrader Windows.
Nine timeframe cards
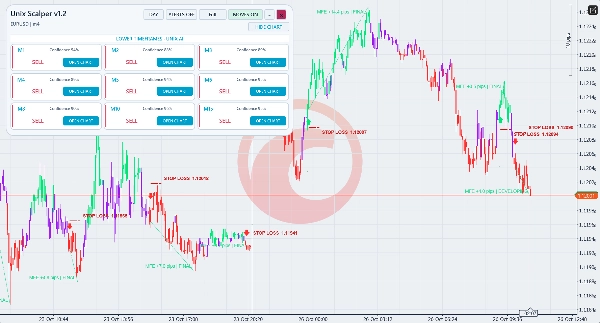
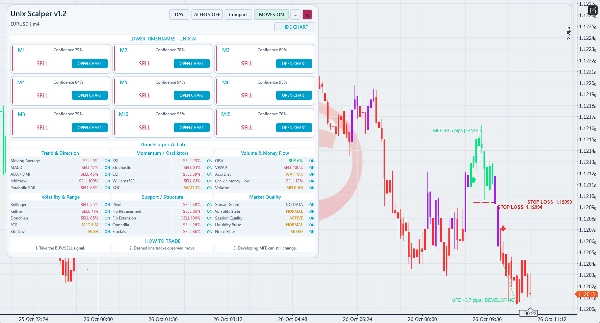
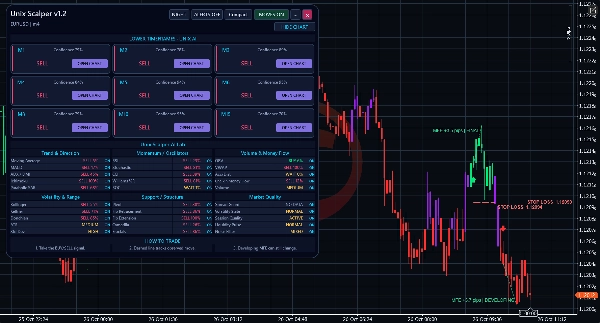
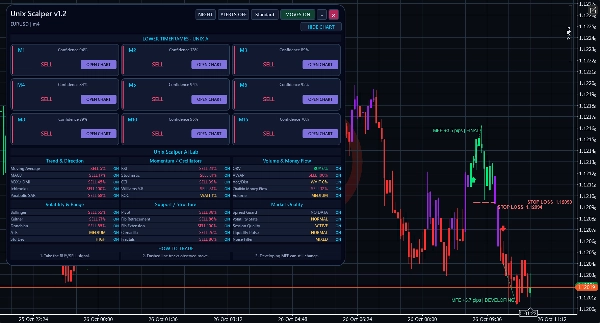
View M1, M2, M3, M4, M5, M6, M8, M10 and M15 for the chart symbol. Each card displays BUY, SELL, WAIT or unavailable data and a technical rule-agreement reading. OPEN CHART switches to the selected native period. Cards reflect current available data, including when older candles are visible on the chart.
Clear chart signals
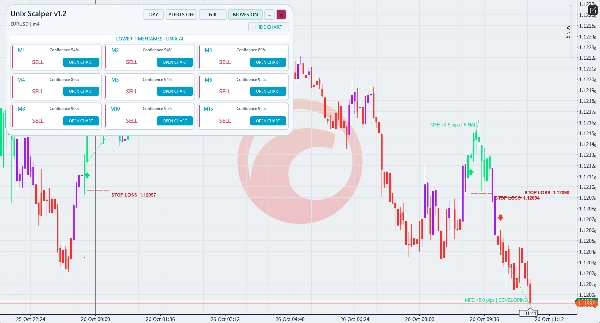
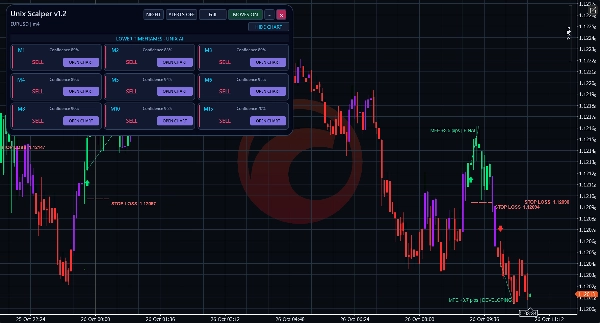
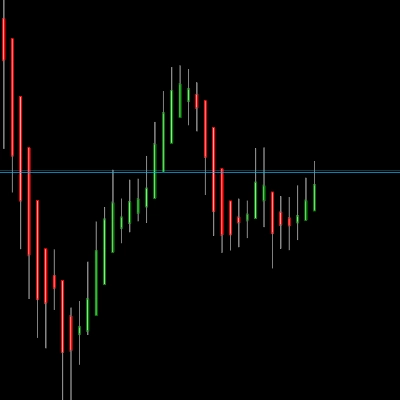
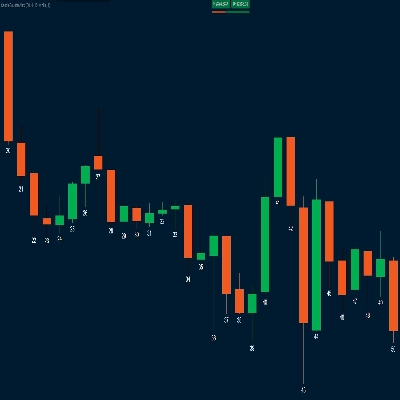
Bright green, red and purple candles identify bullish, bearish and neutral Unix states in Day and Night. Native BUY arrows appear below the entry candle low; SELL arrows appear above its high, with visible spacing. The arrow offset is a display position; signal messages use the entry price.
ATR stop-loss price reference
An optional red dashed line displays STOP LOSS and its price. BUY: entry candle low minus ATR multiplied by the buffer. SELL: entry candle high plus ATR multiplied by the buffer. Default settings are enabled, ATR period 14 and buffer multiplier 1.0. Period and multiplier are adjustable in the native indicator parameters. ATR is the arithmetic mean of completed pre-entry true ranges. The level follows the entry wick while that candle forms and becomes fixed when it closes. Prior history is required. This line is for manual planning and does not place a broker stop order or limit account losses.
Technical evidence
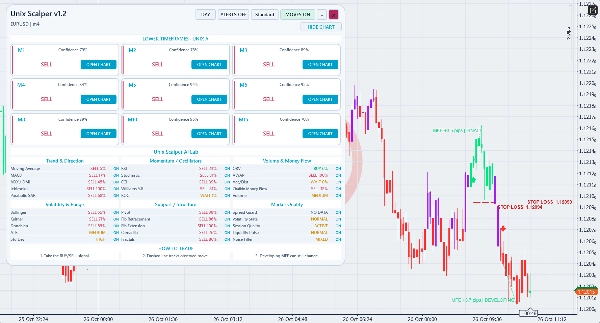
The AI Lab shows thirty local, rule-based assessments across trend, momentum, volume, volatility, structure and market quality. Disagreement and unavailable data remain visible. The confidence reading describes technical agreement rather than a forecast of trading returns.
Observed chart moves
Dashed move annotations describe favourable price excursions after accepted entries. DEVELOPING observations may extend; FINAL observations are completed historical measurements. These are chart observations, not executed account results or take-profit instructions. Execution costs are not included.
Workspace and alerts
Use Standard or Compact for the nine cards, thirty evidence rows and guidance footer. Full provides the nine-card view. Switch Day/Night, drag, collapse and restore the panel, or hide indicator drawings. MOVES controls entry arrows, move annotations and stop references together. Candle colouring is enabled by default. Optional popup and email alerts report a new BUY or SELL and its entry price. Email requires cTrader email configuration and sender/recipient addresses. Historical loading establishes a silent alert baseline.
Intended use
For manual lower-timeframe scalping and intraday analysis. Gallery examples use EURUSD M1 and M4. Availability depends on broker instruments and history. The indicator does not open, modify or close orders. Assess it on a demo chart with sufficient history and manage entries, exits and position size separately.
Trading involves risk. Past performance does not guarantee future results.
Summary
The indicator features vivid candle coloring—green for bullish, red for bearish, and purple for neutral states—distinguished for Day and Night modes. Native BUY and SELL arrows mark entry points with clear positioning relative to candle highs and lows.
An optional ATR-based stop-loss reference line is displayed as a red dashed line, calculated using the entry candle’s high or low adjusted by an ATR buffer multiplier. This line serves as a manual planning tool and does not execute stop orders.
Unix Scalper provides technical evidence through thirty local rule-based assessments covering trend, momentum, volume, volatility, structure, and market quality, with visible disagreement and unavailable data. It also annotates observed price moves after accepted entries as developing or final.
The workspace offers Standard, Compact, and Full views with customizable Day/Night modes, drag-and-collapse panel options, and controls for arrows, annotations, and stop references. Optional popup and email alerts notify new BUY or SELL signals with entry prices. The indicator supports manual scalping and intraday analysis without automated order management.
Discussion
Customer reviews
5 | 33 % | |
4 | 67 % | |
3 | 0 % | |
2 | 0 % | |
1 | 0 % |
FAQ










Price