present
Sign up and get $50 off your first purchase
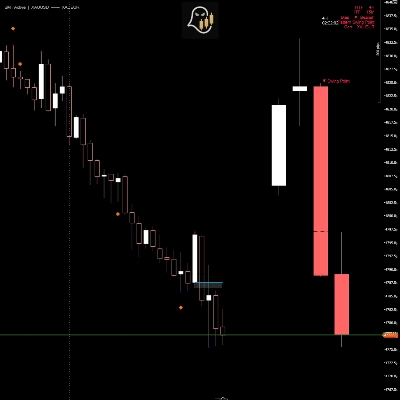
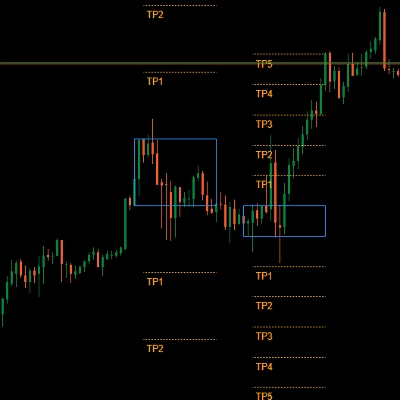
Trading product for ICT PO3 AMD Indicator SMA Market Structure, image 1
ICT PO3 AMD
Indicator
69 downloads
Version 1.0, Apr 2026
Windows, Mac
Trading product for ICT PO3 AMD Indicator SMA Market Structure, image 2
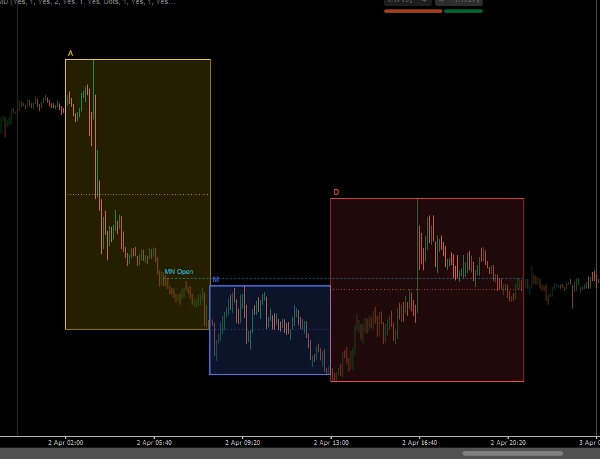
Trading product for ICT PO3 AMD Indicator SMA Market Structure, image 3
51
Sales
1.4K
Free installs

Description

ICT PO3 AMD by IANTIAI is based on the original ICT Power of 3 concept and helps traders identify the three main market phases: Accumulation, Manipulation, and Distribution.

It is designed for real-time New York session analysis and includes the New York Midnight Open as an important reference level. The indicator provides a clean visual structure directly on the chart, making it easier to follow session behavior and understand how price develops through the AMD cycle.

This tool is made for traders who want a clearer view of market structure, possible manipulation, and overall session flow. It is suitable for ICT traders, intraday traders, and anyone focused on New York session logic.

Note: This indicator is for chart analysis and decision support only. It does not execute trades automatically and does not guarantee profits.

ICT PO3 AMD by IANTIAI is built on the original ICT Power of 3 concept and highlights the three key market phases: Accumulation, Manipulation, and Distribution.

Summary

AI summary
ICT PO3 AMD is a market structure indicator based on the ICT Power of 3 concept, designed to identify three key market phases: Accumulation, Manipulation, and Distribution. It focuses on real-time analysis of the New York trading session, incorporating the New York Midnight Open as a critical reference level. The indicator visually overlays these phases directly on the price chart, providing traders with a clear framework to observe session behavior and price development through the AMD cycle. It is intended for traders interested in understanding market structure and session flow, particularly those using ICT methodologies or trading intraday during the New York session. This tool supports analysis and decision-making but does not execute trades automatically. It is compatible with bar and tick data and provides visual signals related to trend strength and session open range.
Indicator profile
Indicator category
Market structure (SMC)
Output type
Visualisation
Data requirements
Bars only
Tick data
Supported signals
Trend strength
Session opening range

Customer reviews

0.0
Reviews: 0
Customer reviews
No reviews for this product yet. Already tried it? Be the first to tell others!

Discussion

FAQ

SMA
Market Structure
Products available through cTrader Store, including trading bots, indicators and plugins, are provided by third-party developers and made available for informational and technical access purposes only. cTrader Store is not a broker and does not provide investment advice, personal recommendations or any guarantee of future performance.

More from this author

Indicator
Forex
Signal
Market Session BT
Indicator
Prop
Forex
+5
Half Trend – Trend Reversal Indicator for cTrader
Indicator
Prop
Forex
+4
Camarilla β€” a precise, non-repainting pivot indicator for cTrader.
Indicator
Prop
Forex
+12
Half Trend Cloud
Indicator
Prop
Forex
+4
Bar Time Timeframe / Renko
Indicator
Prop
Forex
+4
HMA MTF 2.0 (Multi-Timeframe )
Indicator
Forex
BTCUSD
+10
Belkhayate PRC (Polynomial Regression Channel)
Indicator
Prop
Forex
+3
Price Change Bundle 3-in-1 Levels β€’ Bars β€’ Histogram. Secret of Price Change
Indicator
Prop
Forex
+1
DXY Valuation Zones
Indicator
Prop
Forex
+5
Price Level DWM BT
cBot
AI Trading
AI Integration
Export cTrader market data to CSV or JSON for Python, AI, backtesting and quantitative research.

You may also like

Indicator
ADX
ATR
+5
EMA-cross signals scored on six confluence layers, with an ATR stop, three targets and a live panel
Indicator
Forex
Indices
+1
Detects HTF bias using CRT, Expansion & Swing Point patterns with SMT/PSP divergence β€” visualised in a floating candle
Indicator
ADX
ATR
+2
GOLD SENTINEL v1.0 - A CANDLE-COLORING INDICATOR FOR GOLD.
Indicator
MSS
Volume
+3
Rejection-based volume profile with tiered heat zones, POC levels and a fully draggable anchor on cTrader.
Indicator
AI
ATR
+13
Liquidity Pressure Index is a tool that gives traders deeper insights into the hidden dynamics of market liquidity
Indicator
AI
ATR
+26
SR Commander β€” Multi Timeframe Edition. See where the big money draws the line. Trade on your timeframe. Think on theirs
Indicator
Bollinger
ADXR, KDJ, SineWave, Bollinger Band Volatility and AEOscillator.
"ORB v1" logo
Popular
5.0
(3)
$19
Indicator
Breakout
Opening Range Breakout (ORB) - Visual Edition
Indicator
RSI
Stochastic
+2
Composite mean-reversion oscillator merging Z-Score, RSI & Bollinger %B into one clear overbought/oversold signal.
Indicator
ATR
RSI
+24
Daily moving averages, simplified. Displays 3 daily moving averages on lower timeframes with selectable MA types.
Indicator
CHOCH
Inducement
+5
TradeLens - Frame the Trade. Refine the Entry. Two Timeframes. One Decision.
Indicator
The Weekly Daily Levels indicator shows the OHLC, and mid-point prices for the previous day and week.
Indicator
Volume
Fixed Range Volume Profile
Indicator
Smart Signal Reversal Trend + Patterns
Indicator
Key Levels
Support & Resistance
Clean psychological round-number grid with native pip and point auto-scaling across Forex, Gold, Indices, and Crypto.
Indicator
Breakout
Open Range Breakout by SLA is a fully customizable multi-session indicator designed for structured intraday traders.
Indicator
Forex
EURUSD
+4
Check the correlations between dozens of assets in one elegant display.
Indicator
Multi Timeframe Candle drawing. Draw Any candles from any timeframe on your chart :-)

Price

51
Sales
1.4K
Free installs