
Beschreibung
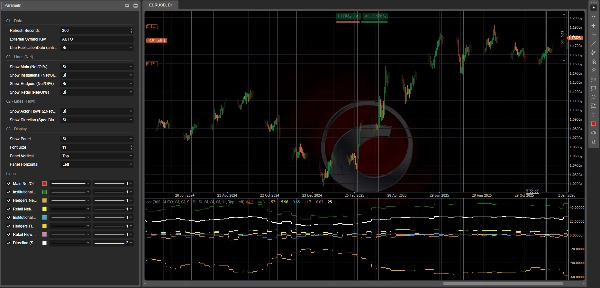
📊 COT Indikator Geschichte Pro — Akteursfluss + Richtung (Institutionell / Hedger / Einzelhandel)
CotIndicatorHistoryPro bringt eine erweiterte Commitments of Traders (COT) Anzeige direkt in Ihr Chart, mit einer klaren Aufschlüsselung nach Marktteilnehmern (Institutionell, Hedger/Commercial, Einzelhandel).
Es zeigt nicht nur wo sich jeder Akteur positioniert (überwiegend long/short), sondern auch was sie gerade tun (Longs oder Shorts erhöhen), plus eine synthetische Richtungslinie zur Hervorhebung der vorherrschenden Tendenz.
Der Indikator lädt seinen Datensatz aus einem gesicherten JSON-Feed (HISTORIE + AUSGABE) und richtet ihn sicher im Chart aus (Anti-Lookahead-Option unter Verwendung von PublicationDate).
🗓️ Wöchentliche Datenaktualisierung (Freitag 21:00)
Der COT-Datensatz wird jeden Freitag um 21:00 Uhr (Europa/Rom Zeit) aktualisiert dank einer dedizierten Automatisierungspipeline:
Ein ausgeklügeltes Verarbeitungsskript führt die Berechnungen durch und veröffentlicht die aktualisierten Werte im JSON-Feed, der vom Indikator (und dem zugehörigen cBot-Ökosystem, falls installiert) verwendet wird.
✅ Der Indikator selbst aktualisiert sich auf der Plattform mit Ihrer Refresh Seconds Einstellung und zeigt die neuen wöchentlichen Daten an, sobald sie veröffentlicht werden.
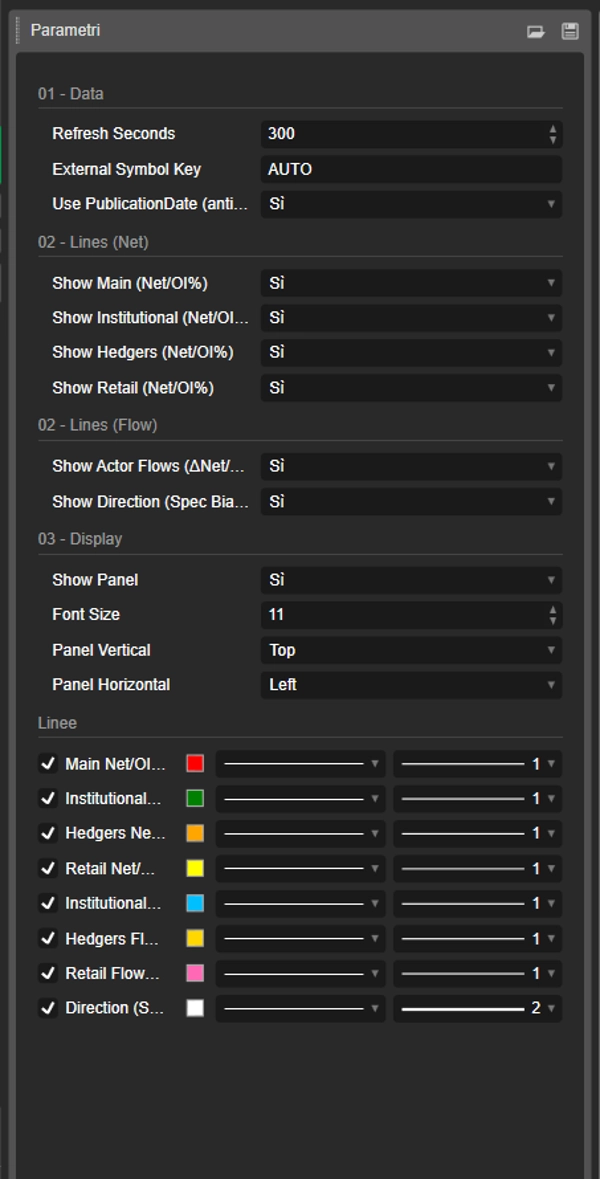
✅ Was Sie erhalten (Linien + Panel)
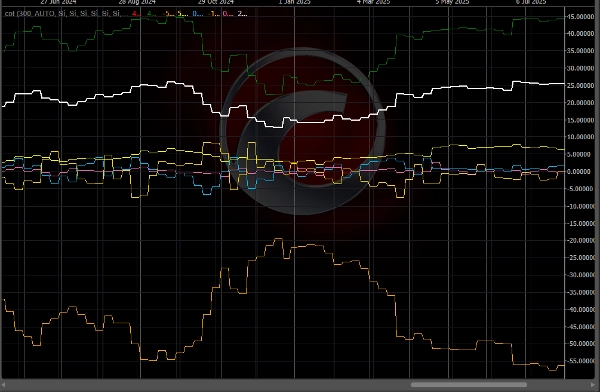
🔥 „Flow“-Linien (3 Akteure) — ΔNet/OI%
Diese Linien stellen die Wochen-zu-Wochen-Änderung der Netto-Positionen dar, normalisiert durch das Open Interest:
- 🔵 Institutioneller Flow (ΔNet/OI%)
- 🟡 Hedger / Commercial Flow (ΔNet/OI%)
- 💗 Einzelhandels-Flow (ΔNet/OI%)
📌 Wie man es liest:
- Über 0 ⇒ der Akteur erhöht Netto LONG (fügt Long-Positionen hinzu und/oder deckt Shorts ab)
- Unter 0 ⇒ der Akteur erhöht Netto SHORT (fügt Short-Positionen hinzu und/oder reduziert Long-Positionen)
- Größere absolute Werte (z.B. ±1,5%, ±3%) ⇒ stärkere und bedeutendere Positionsänderungen
🧭 „Richtungs“-Linie — Spekulative Tendenz Net/OI%
- ⚪ Richtung (Spekulative Tendenz) Net/OI% fasst die vorherrschende „spekulative“ Richtung zusammen (Durchschnitt von Institutionell + Einzelhandel, mit Fallback falls nötig).
📌 Wie man es liest:
- > 0 ⇒ Spekulative Tendenz LONG
- < 0 ⇒ Spekulative Tendenz SHORT
- ≈ 0 ⇒ FLACH / neutral Phase
🧩 Info-Panel (Voller Kontext)
Ein integriertes Panel zeigt an:
- 📄 Berichtsdatum / Veröffentlichungsdatum
- 📌 Open Interest + WoW (Wochen-zu-Woche) Änderung
- 🎯 Textsignal (falls in OUTPUT verfügbar)
- Für jeden Akteur:
-
- Tendenz (überwiegend LONG / SHORT / FLACH) basierend auf Netto
- Net/OI%
- Flow (ΔNet/OI%)
- WoW ΔLong / ΔShort / ΔNet um zu verstehen wie sich die Position verändert hat
🧠 Wie man es liest (Einfach & Praktisch)
✅ Flow vs Tendenz (Wesentlicher Unterschied)
- Flow = was sie gerade tun (fügen Longs oder Shorts hinzu)
- Tendenz = wie sie insgesamt positioniert sind (überwiegend long oder short)
Beispiel:
- Institutionell Tendenz LONG + positiver Flow ⇒ sie erhöhen weiterhin Long-Positionen
- Institutionell Tendenz LONG + negativer Flow ⇒ Long-Reduktion / mögliche Rotation
🚦 Typische Handelsszenarien
✅ Szenario A — Trendbestätigung
- Richtung > 0
- Institutioneller Flow > 0
➡️ Long-Druck ist konsistent: oft ein Setup zur Fortsetzung.
✅ Szenario B — Potenzielle Umkehr (Smart Money vs Einzelhandel)
- Institutioneller Flow > 0 während Einzelhandels-Flow < 0
➡️ Einzelhandel verkauft/shortet, während Institutionen kaufen: mögliche Akkumulation.
(Gegenteil = mögliche Distribution)
✅ Szenario C — Hedger als „Alarm“
- Hedger auf extremen Niveaus (Net/OI weit von neutral entfernt) + starker Flow
➡️ Mögliche Überzone / aggressive Absicherung (oft besser als Warnung als direkter Einstiegssignalgeber).
✅ Szenario D — Markt „Lädt auf“ (Breakout-Risiko)
- Starker Flow + Open Interest WoW steigend
➡️ Neue Positionen kommen rein: Wahrscheinlichkeit für ausgedehnte Bewegungen steigt oft.
⚡ 10-Sekunden-Leseroutine
- Prüfen Sie die Richtung: LONG (>0) oder SHORT (<0)
- Prüfen Sie den Institutionellen Flow: bestätigt oder divergiert er?
- Prüfen Sie den Einzelhandels-Flow: bestätigt oder verhält er sich gegenteilig?
- Prüfen Sie das Open Interest WoW: Expansion oder Positionsabbau?
✅ Unterstützte Symbole + Schlüssellegende (JSON Symbolschlüssel)
Der Indikator kann jedes im JSON-Feed verfügbare Instrument analysieren (Feld data[].symbol in OUTPUT).
Wie man das richtige Instrument auswählt
- Externer Symbolschlüssel = AUTO 👉 verwendet automatisch das Chartsymbol (und entfernt jeglichen Suffix nach „.“ z.B.
US2000.ecn→US2000). - Wenn Ihr Broker andere Symbolnamen verwendet 👉 setzen Sie Externer Symbolschlüssel auf den genauen JSON-Schlüssel (Groß-/Kleinschreibung egal).
Aktuelle Schlüssel im Feed (Beispiel-Snapshot: reportDate 2026-02-17, publicationDate 2026-02-20)
- FX:
AUDUSD,EURUSD,GBPUSD,USDMXN - Indizes:
US100,US2000,DOW30,VIX - Rohstoffe/Metalle/Landwirtschaft:
BRENT,WTI,COPPER,CORN,WHEAT,XAU(Gold),XAG(Silber) - Krypto:
BTC,ETH
📌 Wenn Sie keine Werte im Chart sehen:
- überprüfen Sie, ob das Chartsymbol mit einem JSON-Schlüssel übereinstimmt
- setzen Sie den Externen Symbolschlüssel manuell (z.B.
ETH,US2000) - prüfen Sie das Panel Berichts-/Veröffentlichungsdatum, um zu bestätigen, dass der neueste Datensatz geladen wurde
⚙️ Hinweise
- Unterstützt sicherere Ausrichtung mit Use PublicationDate (Anti-Lookahead) ✅
- Linien und Panel können einzeln ein- oder ausgeschaltet werden.
📌 Haftungsausschluss: rein informativer Indikator, keine Finanzberatung. COT-Daten sind wöchentlich und sollten im Kontext von Trend, Schlüsselbereichen und Volatilität betrachtet werden.
Zusammenfassung
The indicator sources data from a secured JSON feed updated every Friday at 21:00 (Europe/Rome time) and aligns it on the chart using publication dates to prevent lookahead bias. Users can view flow lines for each actor, a direction line indicating overall market bias, and an info panel detailing report dates, open interest, net positions, and weekly changes.
It supports a wide range of instruments including Forex pairs (e.g., EURUSD, GBPUSD), indices (e.g., US100, DOW30), commodities (e.g., Brent, Gold), and cryptocurrencies (BTC, ETH). Symbol selection can be automatic or manually set to match feed keys.
Typical use cases include trend confirmation, spotting potential reversals by comparing smart money and retail flows, hedger activity alerts, and breakout risk assessment based on open interest changes. The indicator is informational and designed to complement other technical analysis tools.
Kundenbewertungen
5 | 50 % | |
4 | 50 % | |
3 | 0 % | |
2 | 0 % | |
1 | 0 % |


