
Beschreibung
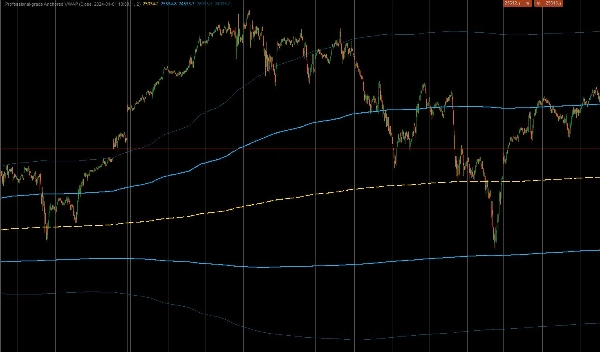
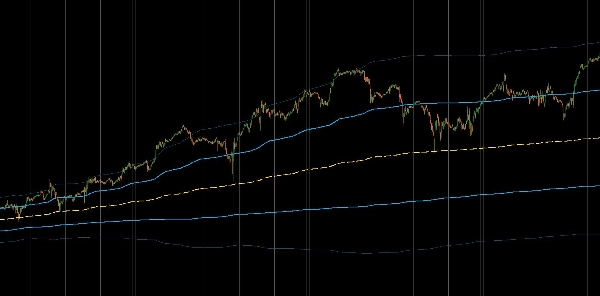
Dies ist ein professioneller, maßgeschneiderter Indikator für cTrader, der entwickelt wurde, um den Anchored Volume Weighted Average Price (AVWAP) zu berechnen. Im Gegensatz zu Standard-VWAP-Indikatoren, die täglich zurückgesetzt werden, ermöglicht dieses Tool den Händlern, die Berechnung an ein bestimmtes, hochwirksames Ereignis zu „verankern“ – wie z. B. eine CPI-Veröffentlichung, einen Marktabsturz oder den Beginn eines Trends – und bietet so eine echte institutionelle Sicht auf den Durchschnittspreis seit diesem Zeitpunkt. Es enthält auch volumengewichtete Standardabweichungsbänder, um überdehnte Kursbewegungen zu identifizieren.
1. Kernberechnung & Verankerungslogik
- Präzise Verankerung: Der Indikator verwendet ein vom Benutzer definiertes
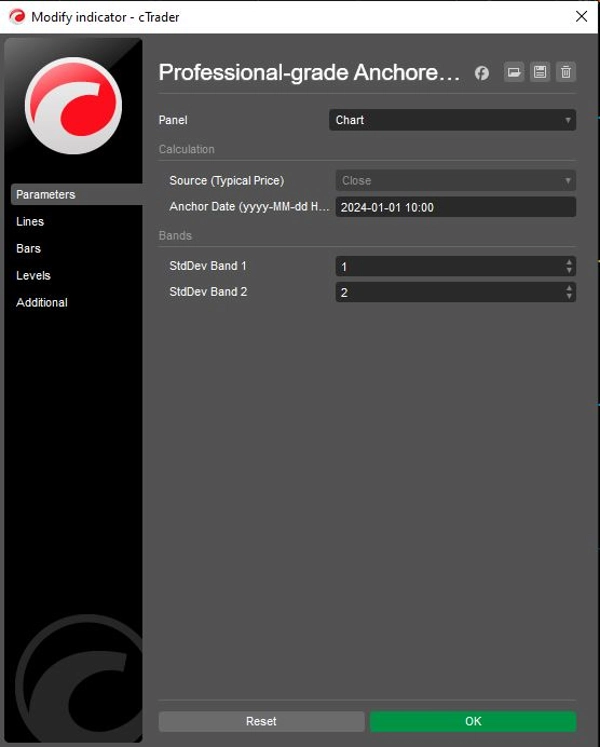
Anchor Date(z. B. „2024-01-01 10:00“), um alle Daten vor dieser spezifischen Minute strikt zu ignorieren. Dies stellt sicher, dass der Durchschnittspreis nur die Teilnehmer widerspiegelt, die an der aktuellen spezifischen Bewegung oder dem Zeitrahmen beteiligt sind. - Institutionelle Formel: Es berechnet den echten VWAP unter Verwendung der kumulativen Summe von (Preis × Volumen) geteilt durch die kumulative Summe des Volumens.
- Typische Preisquelle: Standardmäßig verwendet es den „Typical Price“
(Hoch + Tief + Schluss) / 3für Berechnungen, was die Standardmethode ist, die von institutionellen Algorithmen zur Bestimmung des fairen Werts verwendet wird, obwohl dies auf Open- oder Close-Preise angepasst werden kann.
2. Erweiterte Volatilitätsbänder
Um Händlern zu helfen, Marktexzesse einzuschätzen, berechnet der Indikator zwei Sätze dynamischer Bänder basierend auf volumengewichteter Varianz:
- Band 1 (Die Wertzone): Standardmäßig auf 1,0 Standardabweichung gesetzt. Diese innere Zone enthält typischerweise das „faire Wert“-Rauschen des Marktes. Ein Ausbruch aus dieser Zone signalisiert oft Momentum.
- Band 2 (Die Extremzone): Standardmäßig auf 2,0 Standardabweichungen gesetzt. Preise, die dieses äußere Band erreichen, sind statistisch überdehnt und signalisieren oft potenzielle Chancen für eine Mittelwertumkehr (das Bewegen abschwächen) oder eine starke Trenderschöpfung.
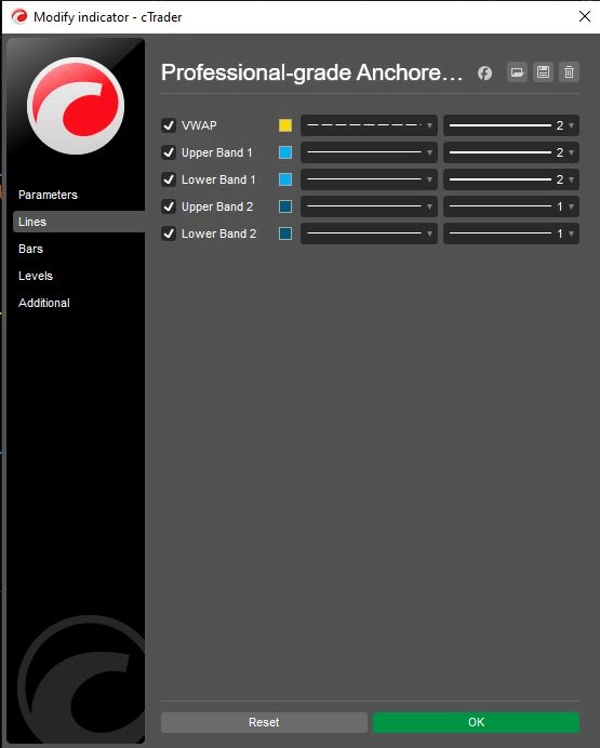
- Unabhängige Steuerung: Beide Bänder enthalten individuelle
Show-Schalter (ShowBand1,ShowBand2) und anpassbare Abweichungsmultiplikatoren (Band1Dev,Band2Dev), die saubere Charts ermöglichen, die auf spezifische Volatilitätsstrategien zugeschnitten sind.
3. Visuelle & operative Logik
- Strategische Farbgebung:
-
- Gelb (VWAP): Dient als zentraler „Magnet“ oder Trend-Baseline.
- Limettengrün (Band 1): Repräsentiert die unmittelbare Unterstützungs-/Widerstands-„Wertzone“.
- Rot (Band 2): Hebt extreme Abweichungen hervor, bei denen die Wahrscheinlichkeit einer Umkehr steigt.
- Zustandserhaltung: Der Code verwendet
IndicatorDataSeriesfür interne Zustandsvariablen (_cumVol,_cumPV), um sicherzustellen, dass Werte während historischer Neuberechnungen und Echtzeit-Updates ohne Repaint-Fehler genau bleiben.
Logikfluss-Zusammenfassung
- Initialisieren: Den spezifischen Anchor Date-String des Benutzers in ein System-Datum-Uhrzeit-Objekt parsen.
- Zeit filtern: Für jede Kerze prüfen, ob die aktuelle Zeit vor dem Anchor liegt. Falls ja,
NaNzurückgeben (nichts zeichnen) und kumulative Zähler auf null zurücksetzen. - Daten akkumulieren: Sobald die Anchor-Zeit erreicht ist, das Volumen der aktuellen Kerze und (Preis × Volumen) zum laufenden Gesamtwert hinzufügen.
- VWAP berechnen: Die laufende PV-Summe durch die laufende Volumensumme teilen, um die VWAP-Linie zu erhalten.
- Varianz berechnen: Volumengewichtete Varianz berechnen und die Standardabweichung ableiten.
- Bänder zeichnen: Die berechnete Abweichung zum VWAP addieren/subtrahieren, um die limettengrünen und roten Bänder zu zeichnen.
Zusammenfassung
Key features include:
- Precision anchoring to a user-specified date and time, ignoring data before that moment.
- Institutional VWAP calculation using cumulative (Price × Volume) divided by cumulative Volume.
- Default use of Typical Price ((High + Low + Close) / 3) for fair value, adjustable to Open or Close prices.
- Two dynamic volatility bands based on volume-weighted variance: Band 1 (1 standard deviation) representing the value zone, and Band 2 (2 standard deviations) indicating extreme price deviations.
- Independent toggles and customizable deviation multipliers for each band.
- Strategic color coding: yellow for VWAP, lime green for Band 1, and red for Band 2.
- Internal state preservation ensures accurate values during historical and real-time updates without repainting.
The indicator supports markets including Forex, indices, commodities, stocks, and cryptocurrencies, and is suitable for various symbols such as BTCUSD, EURUSD, GBPUSD, XAUUSD, and NAS100.
Kundenbewertungen
5 | 50 % | |
4 | 50 % | |
3 | 0 % | |
2 | 0 % | |
1 | 0 % |


