
Fixed Range Volume Profile
Indikator
2 käufe
Version 1.0, Jan 2026
Windows, Mac
4.0
Bewertungen: 2
Beschreibung
Wie man das Fixed Range Volume Profile (FRVP) verwendet
- Aktivieren Sie den Indikator: Ziehen Sie den FRVP-Indikator auf Ihr gewünschtes Chart aus dem cTrader Automate- oder Indikatoren-Menü.
- Wählen Sie das Analysetool: Finden Sie das Standard-Rechteck-Zeichenwerkzeug in der cTrader-Symbolleiste (normalerweise auf der rechten oder linken Seite der Plattform).
- Definieren Sie Ihren Bereich: Klicken und ziehen Sie das Rechteck über die spezifische Kursbewegung und den Zeitraum, den Sie analysieren möchten.
- Initialisieren Sie das Profil: Nach dem Zeichnen klicken und schieben Sie das Rechteck leicht. Dieses "Handshake" zwischen der Zeichnung und dem Indikator löst die Volumenberechnung aus und erzeugt sofort das Histogramm, POC und Value Area Linien.
- Dynamisch anpassen: Sie können die Kanten des Rechtecks ziehen, um den Zeitraum zu erweitern oder es auf ein anderes Kursniveau zu verschieben; das Volumenprofil wird automatisch neu berechnet, um den neuen Bereich widerzuspiegeln.
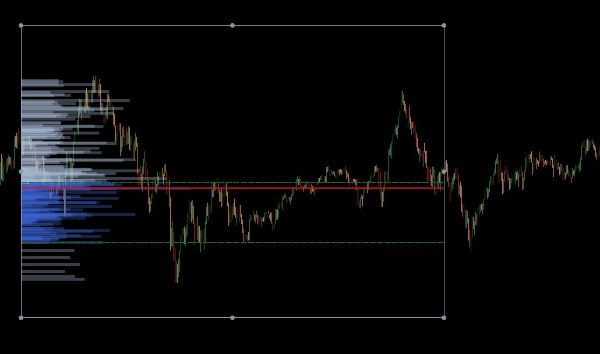
Das Fixed Range Volume Profile (FRVP) für cTrader ist ein ausgeklügeltes Analysetool, das entwickelt wurde, um bedeutende Kursniveaus zu identifizieren, indem es die Volumenverteilung über einen bestimmten Zeit- und Kursbereich berechnet. Im Gegensatz zu Standard-Volumenindikatoren, die sich auf die Zeit beziehen, konzentriert sich dieser Indikator auf die Kursdichte, um die Marktstimmung zu offenbaren.
Kernfunktionen
- Dynamische Bereichsauswahl: Der Indikator berechnet und aktualisiert automatisch, wann immer Sie ein Standardrechteck in Ihrem cTrader-Chart zeichnen oder verschieben.
- Identifikation wichtiger Niveaus:
-
- Point of Control (POC): Hebt das Kursniveau mit dem höchsten gehandelten Volumen hervor und wirkt als "Magnet" für die Kursbewegung.
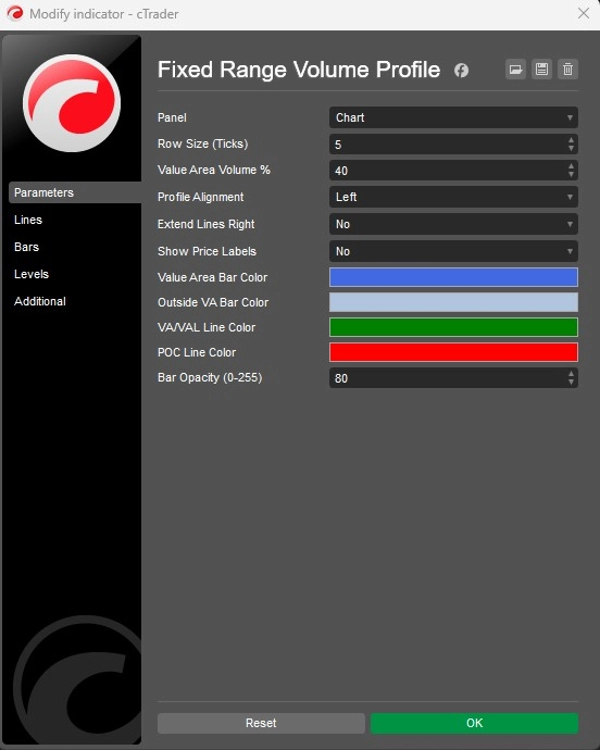
- Value Area High/Low (VAH/VAL): Definiert die Grenzen, innerhalb derer ein bestimmter Prozentsatz des Volumens (Standard 40%) gehandelt wurde.
- Anpassbare Layouts:
-
- Ausrichtung: Wählen Sie, ob das Volumenhistogramm auf der linken oder rechten Seite des Rechtecks angezeigt wird.
- Granularität: Passen Sie die Reihengröße (Standard 5 Ticks) an, um die Detailgenauigkeit der Volumenbalken zu steuern.
- Visuelle Gestaltung: Volle Kontrolle über Balkenfarben (Value Area vs. Außenbereich), Opazität und Sichtbarkeit der Kursbeschriftungen.
Strategische Anwendung
- Unterstützung & Widerstand: High Volume Nodes (HVN) fungieren oft als starke Unterstützungs- oder Widerstandszonen, während Low Volume Nodes (LVN) "dünne" Bereiche darstellen, in denen sich der Kurs schnell bewegen kann.
- Trendbestätigung: Verwenden Sie die Extend Right Funktion, um zu sehen, wie historische Volumenniveaus mit der aktuellen Kursentwicklung interagieren.
Zusammenfassung
KI-Zusammenfassung
The Fixed Range Volume Profile (FRVP) indicator for cTrader analyzes volume distribution within a user-defined price and time range using a standard rectangle drawing tool. By selecting and adjusting this rectangle on the chart, the indicator dynamically calculates and displays a volume histogram along with key levels: Point of Control (POC), which marks the price with the highest traded volume, and Value Area High/Low (VAH/VAL), defining the volume concentration boundaries. Users can customize the histogram’s alignment, granularity (row size), colors, opacity, and price label visibility. The indicator supports dynamic range adjustments by dragging the rectangle edges, automatically recalculating volume data. Strategically, it helps identify support and resistance zones through high and low volume nodes and offers trend confirmation by extending volume levels into current price action. The FRVP is applicable across various markets including Forex, cryptocurrencies, commodities, indices, and stocks, and supports symbols such as BTCUSD, EURUSD, GBPUSD, XAUUSD, and NAS100. It integrates with cTrader’s drawing tools and provides a detailed volume-based perspective on price action beyond standard time-based volume indicators.
Indikatorprofil
Kundenbewertungen
4.0
Bewertungen: 2
5 | 0 % | |
4 | 100 % | |
3 | 0 % | |
2 | 0 % | |
1 | 0 % |
Diskussion
Häufig gestellte Fragen (FAQ)
BTCUSD
Forex
Signal
Breakout
Indices
EURUSD
Commodities
GBPUSD
NZDUSD
Fibonacci
Prop
Scalping
Fair Value Gap
SMC
Crypto
Stocks
XAUUSD
NAS100
USDJPY
VWAP
Über den cTrader Store verfügbare Produkte, einschließlich Handelsbots, Indikatoren und Plugins, werden von externen Entwicklern bereitgestellt und nur zu Informations- und technischen Zugriffszwecken verfügbar gemacht. cTrader Store ist kein Broker und erbringt keine Anlageberatung, persönlichen Empfehlungen oder eine Garantie für zukünftige Performance.
Mehr von diesem Autor


Preis
Seit 26/09/2025
13
Verkäufe