

Beschreibung
Deep Mood Distribution (DMD) 📊🧠
Überblick
Deep Mood Distribution (DMD) ist ein segmentiertes Volumenprofil- und Sentiment-Tool, das die Kursbewegung in festen Balkenblöcken analysiert und zeigt:
- Wo die Handelsaktivität konzentriert ist ⚖️
- Wo Liquidität dünn oder reaktiv ist (potenzielle S&D / Liquiditätszonen) 💧
- Welche Seite in jedem Preisbereich dominiert (Käufer vs Verkäufer) 🐂🐻
Anstatt eines einzelnen gleitenden Profils teilt DMD das Chart in wiederholende Blöcke von X Balken auf und erstellt für jeden Block eine separate Liquiditäts- und Sentiment-Karte.
Dies erleichtert den visuellen Vergleich, wie Volumenverteilung und Marktstimmung sich von einem Segment zum nächsten ändern.
Funktionsweise 🧩
Für jeden Block von Bars In Profile Kerzen:
- Der Indikator findet den höchsten und niedrigsten Preis dieses Blocks.
- Der Preisbereich wird in
Number of Rowsvertikale Preisabschnitte aufgeteilt. - Für jede Kerze im Block:
-
- Tick-Volumen wird auf die von der Kerze berührten Preisabschnitte verteilt.
- Für jede Zeile werden zwei Volumina akkumuliert:
-
- Gesamtvolumen in dieser Preiszeile
- Bullishes Volumen (nur Balken, bei denen Schluss > Eröffnung)
- Aus diesen Daten erstellt DMD:
-
- Liquiditätsprofil (rechte Seite)
-
- Zeilenlänge ∝ relatives Volumen im Vergleich zum maximalen Zeilenvolumen des Blocks
- Farbe zeigt hohe / durchschnittliche / niedrige gehandelte Knoten
- Sentiment-Profil (linke Seite)
-
- Sentiment pro Zeile =
2 × BullishVolume − TotalVolume - Positiv = Käufer-dominant (bullishe Stimmung)
- Negativ = Verkäufer-dominant (bearishe Stimmung)
- Sentiment pro Zeile =
- Der Prozess wird für die letzten N Blöcke wiederholt, sodass mehrere Segmente nebeneinander verglichen werden können.
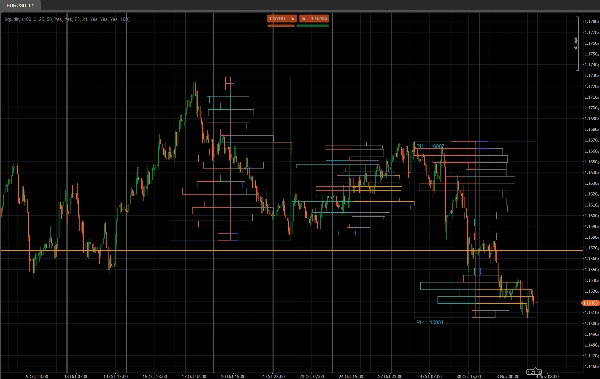
Rechte Seite – Liquiditätsprofil (Volumen) 📊
Die Balken auf der rechten Seite zeigen wie viel Handelsaktivität (Volumen) auf jedem Preisniveau innerhalb dieses Blocks stattfand, unabhängig davon, wer gekauft oder verkauft hat.
- Hochvolumige Knoten (HVN) – z.B. orangefarbene Balken
-
- Eine Zeile, deren Volumen ≥
High Traded Threshold %des maximalen Zeilenvolumens im Block ist - Stellen Wertbereiche, starken Handel, Konsolidierungszonen dar.
- Eine Zeile, deren Volumen ≥
- Niedrigvolumige Knoten (LVN) – z.B. blaue Balken
-
- Eine Zeile, deren Volumen ≤
Low Traded Threshold %des maximalen Zeilenvolumens ist - Stellen dünne Liquiditätszonen, mögliche Ablehnungs- oder Schnellbewegungsbereiche dar.
- Eine Zeile, deren Volumen ≤
- Durchschnittliche Volumenknoten – z.B. graue Balken
-
- Alles zwischen den hohen und niedrigen Schwellenwerten
- “Normale” gehandelte Niveaus, nicht extrem.
🧠 Länge des Balkens (rechte Seite)
→ Proportional zum gesamtgehandelten Volumen in dieser Preiszeile im Vergleich zum Maximalvolumen des Blocks.
Mehr Volumen → längerer Balken.
Wichtige Parameter:
High Traded Threshold %Low Traded Threshold %
Linke Seite – Sentiment-Profil (Marktstimmung) 🧠📉📈
Die Balken auf der linken Seite zeigen das Sentiment / die Dominanz auf jedem Preisniveau: ob Käufer oder Verkäufer in dieser Zeile stärker waren.
Für jede Zeile:
Sentiment=2×BullishVolume−TotalVolume\text{Sentiment} = 2 \times \text{BullishVolume} - \text{TotalVolume}Sentiment=2×BullishVolume−TotalVolume
- Bullisher Balken (Käufer kontrollieren) – z.B. türkis/grüne Balken
-
- Sentiment > 0
- Mehr Volumen stammt von bullischen Kerzen (Schluss > Eröffnung) auf diesem Preis.
- Zeigt Käuferdominanz in dieser Preiszeile an.
- Bearisher Balken (Verkäufer kontrollieren) – z.B. rote Balken
-
- Sentiment < 0
- Mehr Volumen stammt von bearischen Kerzen (Schluss < Eröffnung).
- Zeigt Verkäuferdominanz an.
🧠 Länge des Balkens (linke Seite)
→ Proportional zum absoluten Wert des Sentiments (|Sentiment|) relativ zur stärksten Zeile im Block.
Stärkere Dominanz (großes Ungleichgewicht zwischen Käufern und Verkäufern) → längerer Balken.
Wichtiger Parameter:
Show Sentiment Profile(ein/aus)
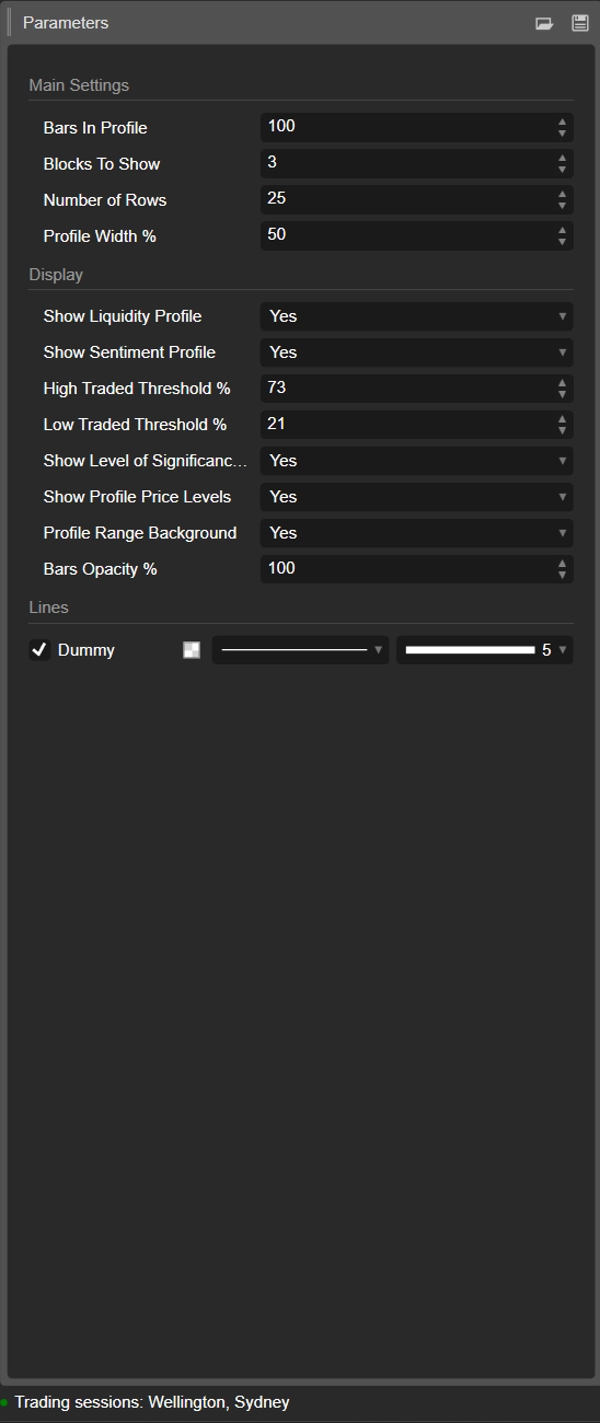
Parameterdetails ⚙️
1. Bars In Profile
Gruppe: Haupteinstellungen
Anzahl der Kerzen, die in jedem Block enthalten sind.
- Beispiel:
Bars In Profile = 100 -
- Block 0 → letzte 100 Balken
- Block 1 → vorherige 100 Balken
- Block 2 → vorherige 100, und so weiter.
Verwenden Sie es, um Blöcke an folgende Zeiträume anzupassen:
- ungefähr Sessions,
- Ihre typische Swing- / Intraday-Range,
- oder jedes beliebige benutzerdefinierte Fenster, das Sie analysieren möchten.
Kleinerer Wert = reaktiver, granularer.
Größerer Wert = glatter, mehr „Makro“-Struktur.
2. Blocks To Show
Gruppe: Haupteinstellungen
Wie viele aufeinanderfolgende Blöcke im Chart angezeigt werden.
1→ nur der aktuellste Block2–3→ sehr praktisch für den Vergleich ohne Überladung- Höhere Werte → mehr Historie, aber mehr Objekte im Chart
Ältere Blöcke jenseits dieses Wertes werden automatisch bereinigt, um die Stabilität zu gewährleisten.
3. Number of Rows
Gruppe: Haupteinstellungen
Vertikale Auflösung des Profils jedes Blocks.
Der Preisbereich des Blocks wird in so viele Zeilen (Preisniveaus) unterteilt.
- Höherer Wert → mehr Details, dünnere Zeilen, mehr Rechtecke
- Niedrigerer Wert → glattere Struktur, leichter zu lesen
Typische Bereiche:
15–25für normalen Intraday-Einsatz30–40+nur wenn Sie sehr feine Auflösung wünschen und Ihre Plattform stark genug ist
4. Profile Width %
Gruppe: Haupteinstellungen
Steuert, wie weit sich das Profil horizontal vom Mittelpunkt des Blocks aus erstreckt, als Prozentsatz der Blockbreite.
- Beeinflusst sowohl Liquidität (rechte Seite) als auch Sentiment (linke Seite).
- Höherer % → Profile erstrecken sich weiter in die umliegenden Balken
- Niedrigerer % → kompaktes Profil nahe dem Blockzentrum
Gute Startwerte: 35–50%.
5. Show Liquidity Profile
Gruppe: Anzeige
Schaltet die Volumenverteilung (Liquiditätsprofil) ein oder aus (rechte Seite jedes Blocks).
- Ein ✅
-
- Die Länge jeder Zeile spiegelt das relative gehandelte Volumen auf diesem Preisniveau wider.
- Farbe kodiert hohe / durchschnittliche / niedrige gehandelte Knoten.
- Aus ❌
-
- Es wird nur das Sentiment (falls aktiviert) angezeigt, keine Volumenbalken rechts.
6. Show Sentiment Profile
Gruppe: Anzeige
Schaltet das Sentiment-Profil ein oder aus (linke Seite jedes Blocks).
- Ein ✅
-
- Zeilen sind farblich gekennzeichnet:
-
- Bullish (Käufer dominant) – z.B. aqua/grün
- Bearish (Verkäufer dominant) – z.B. rot
- Die Länge der Zeile spiegelt die Stärke der Dominanz wider.
- Aus ❌
-
- Es wird nur reine Liquiditäts-/Volumenverteilung angezeigt.
Verwenden Sie dies, wenn Sie nicht nur sehen möchten, wo Volumen gehandelt wurde, sondern wer auf diesen Niveaus aktiver war.
7. High Traded Threshold %
Gruppe: Anzeige
Definiert die Grenze für hochvolumige Knoten (HVNs) innerhalb jedes Blocks.
- Ausgedrückt als % des maximalen Zeilenvolumens des Blocks.
- Beispiel: Max Zeilenvolumen = 10.000; Schwelle = 70% → Zeilen ≥ 7.000 zählen als HVNs.
HVNs markieren oft:
- Wertbereiche,
- Konsolidierungszonen,
- Bereiche mit starker Positionierung / fairem Wert.
8. Low Traded Threshold %
Gruppe: Anzeige
Definiert die Grenze für niedrigvolumige Knoten (LVNs) relativ zum maximalen Volumen des Blocks.
- Zeilen mit Volumen unter diesem Prozentsatz werden als Zonen mit geringer Aktivität behandelt.
- Diese können fungieren als:
-
- dünne Liquiditätstaschen,
- potenzielle Ablehnungsniveaus,
- oder Bereiche, in denen sich der Preis schnell bewegt.
Typische Verwendung: 15–30%.
9. Show Level of Significance (POC)
Gruppe: Anzeige
Zeigt oder verbirgt den Point of Control (POC) für den aktuellsten Block.
- POC = Preiszeile mit höchstem gehandeltem Volumen in diesem Block.
- Wird als horizontale Linie bei diesem Preis dargestellt. 🎯
Nützlich als:
- Referenz für Mean-Reversion,
- Intraday-“Fair Price”-Anker,
- oder Schlüssel-Level für das Trade-Management.
10. Show Profile Price Levels
Gruppe: Anzeige
Zeigt Textbeschriftungen für:
- Profile High (PH) – höchster im Block erreichter Preis
- Profile Low (PL) – niedrigster im Block erreichter Preis
Beschriftungen werden für den aktuellsten Block angezeigt und enthalten die genauen Preiswerte.
Ideal für:
- schnelles Erfassen der aktuellen Range,
- Setzen von Stops/Zielen um PH/PL,
- Kontext für Ausbrüche oder Rotationen.
11. Profile Range Background
Gruppe: Anzeige
Zeichnet ein halbtransparentes Hintergrundrechteck, das jede Block-
- Zeitspanne (Start- bis Endbalken)
- Preisrange (Tief bis Hoch)
Dies trennt die Blöcke visuell und lässt jede Range hervorstechen.
Deaktivieren Sie es, wenn Sie eine sauberere, minimalistische Optik bevorzugen.
12. Bars Opacity %
Gruppe: Anzeige
Steuert, wie deckend oder subtil die Rechtecke sind (sowohl Liquiditäts- als auch Sentiment-Balken).
- 20–40% → sehr leicht, Hintergrundstil
- 50–70% → ausgewogene Sichtbarkeit, Kerzen sind noch gut sichtbar
- 80–100% → starke, fast vollständig undurchsichtige Blöcke
Intern wird dieser Wert in einen Alphakanal (0–255) für die Balkenfarben umgewandelt.
Vorgeschlagenes Start-Template ⭐
Für Indizes / Futures Intraday (M5–M15):
- Bars In Profile: 80–120
- Blocks To Show: 2–3
- Number of Rows: ~20
- Profile Width %: 35–45
- Show Liquidity Profile: true
- Show Sentiment Profile: true
- Bars Opacity %: 50–65
Zusammenfassung
Key features include:
- Liquidity Profile (right side): Displays trading volume concentration at each price level within a block, highlighting high-volume nodes (HVNs), low-volume nodes (LVNs), and average-volume nodes. Bar length corresponds to relative traded volume, and colors indicate volume intensity.
- Sentiment Profile (left side): Shows buyer vs. seller dominance per price level, calculated as twice the bullish volume minus total volume. Positive values indicate buy-side control; negative values indicate sell-side control. Bar length reflects the strength of dominance, with color coding for bullish (green/teal) and bearish (red) sentiment.
- Configurable parameters: number of bars per profile block, number of blocks displayed, vertical resolution (rows), profile width, opacity, and thresholds for defining HVNs and LVNs.
- Additional display options: Point of Control (POC) line for highest volume price in the latest block, profile high/low price labels, and background shading for block ranges.
DMD supports analysis across various markets including indices, commodities, forex, and cryptocurrencies, facilitating identification of trading activity concentration, liquidity zones, and market sentiment shifts within customizable timeframes.
Kundenbewertungen
5 | 0 % | |
4 | 100 % | |
3 | 0 % | |
2 | 0 % | |
1 | 0 % |


