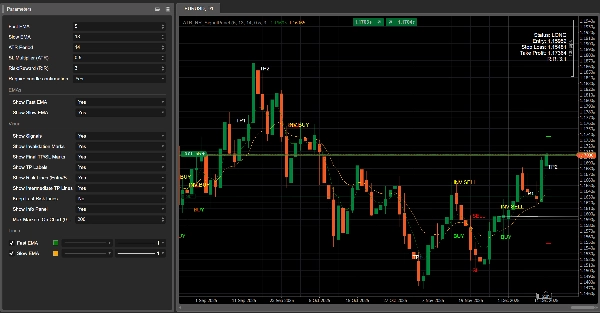

Beschreibung
🔧 ATR_RR_SignalPanel — Technische & detaillierte Beschreibung (EN) 🧠📈
ATR_RR_SignalPanel ist ein Overlay-Indikator für cTrader, der Trendwechsel-Einstiegssignale mit einem Fast EMA vs Slow EMA Regime erzeugt und anschließend ein komplettes virtuelles Handelsframework (Einstieg 🏁, Stop Loss 🛑, Final Take Profit 🎯, Zwischenziele 🟢) mit ATR-basierter Risikobemessung und einem konfigurierbaren Risk:Reward Multiplikator ⚖️ aufbaut.
🧭 Kernlogik (Signal-Engine) 🚦
- Der Indikator berechnet:
-
- Fast EMA ⚡ und Slow EMA 🐢 auf Close.
- ATR (Wilder Glättung) 🌡️ für volatilitätsbasierte Stop-Distanz.
- Ein Trendregime wird definiert als:
-
- Bullentrend 🟢 wenn
Fast EMA > Slow EMA - Bärentrend 🔴 wenn
Fast EMA < Slow EMA
- Bullentrend 🟢 wenn
- Ein Trendwechsel 🔁 wird ausgelöst, wenn der Bull-/Bärenzustand sich vom vorherigen Balken unterscheidet (entspricht Pines
bullTrend != bullTrend[1]).
🎯 Einstiegskriterien (KAUF/VERKAUF) 🟩🟥
Wenn ein Trendwechsel auftritt:
- KAUF-Signal 🟢 wenn:
-
- Bullentrend aktiv und ein Trendwechsel erkannt wird
- Optionale Kerzenbestätigung ✅: Close > Open (bullische Kerze)
- VERKAUF-Signal 🔴 wenn:
-
- Bärentrend aktiv und ein Trendwechsel erkannt wird
- Optionale Kerzenbestätigung ✅: Close < Open (bärische Kerze)
🧪 Virtuelles Positionsmanagement (Kein cBot) 🧩
Dieser Indikator platziert keine Orders. Stattdessen simuliert er eine interne „virtuelle Position“:
- Bei einem neuen KAUF/VERKAUF-Signal werden gesetzt:
-
- Einstiegspreis = aktueller Schlusskurs 🏁
- Stop Loss = Kerzenextremum ± ATR × Multiplikator 🛑
- Finaler Take Profit = Einstieg ± (Risiko × RiskReward) 🎯
- Zwischen-TP-Level = Schritte bei 1R, 2R, … bis floor(RR)-1 🟢
- Er überwacht die Kursbewegung Balken für Balken:
-
- Wenn finaler TP berührt wird ➜ markiert 🎯 und schließt die virtuelle Position ✅
- Wenn SL berührt wird ➜ markiert 🛑 und schließt die virtuelle Position ❌
- Zwischen-TP-Treffer werden nur einmal verfolgt 🧷
🔁 Ungültigkeitslogik (Entgegengesetztes Signal während aktiv) ⚠️
Wenn ein neues Signal eintrifft, während eine virtuelle Position in die entgegengesetzte Richtung besteht:
- Der vorherige Einstieg wird als UNGÜLTIG markiert ⚠️ (INV KAUF / INV VERKAUF)
- Die vorherige virtuelle Position wird beendet 🧯
- Eine neue virtuelle Position wird in der neuen Richtung erstellt 🔄
🧼 Multi-Instanz-Sicherheit (Mehrere Kopien im selben Chart) 🧩🧩
Jede Indikatorinstanz erzeugt eine eindeutige interne ID 🆔, daher:
- Linien/Text von einer Instanz überschreiben nicht eine andere Instanz ✅
- Sie können mehrere Konfigurationen parallel ausführen (z.B. Scalping + Swing) 🧠📊
🧯 Anti-Clutter-Steuerung (Marker-Begrenzer) 🧹✨
Um die Charts lesbar zu halten, kann er:
- Die Anzahl der gezeichneten Textmarker begrenzen (KAUF/VERKAUF/TP/SL/INV/TP1…) 🧾
- Ältere Marker automatisch löschen, wenn das Limit überschritten wird ♻️
🧷 Optionale „Letzte Risiko-Linien behalten“ 🧠📌
Wenn aktiviert, bleiben die letzten Einstiegs-/SL-/TP-Linien auch nach TP/SL-Schluss sichtbar:
- Ideal für Nachhandels-Review 🧑🔬
- Ideal für Journaling 📒✅
⚙️ Parameter — Detaillierte Erklärung (EN) 🔍📌
📈 Signal- & Risiko-Kern
⚡ Fast EMA
- Was es macht 🧠: Legt die Periode des schnellen EMA fest, der zur Erkennung von Regimewechseln verwendet wird.
- Effekt 📊: Niedrigere Werte = reaktiver ➜ mehr Signale; höhere = glatter ➜ weniger Signale.
- Typische Bereiche 🎛️: 3–10 für schnelle Märkte ⚡, 10–20 für ruhigere Setups 🐢
🐢 Slow EMA
- Was es macht 🧠: Legt die Periode des langsamen EMA fest, der als Trendbasislinie dient.
- Effekt 📊: Höherer langsamer EMA = stärkere Filterung ➜ weniger Trendwechsel-Auslöser.
- Typische Bereiche 🎛️: 13–55 je nach Stil 🧭
🌡️ ATR-Periode
- Was es macht 🧠: Steuert die Volatilitätsmesslänge für ATR.
- Effekt 📏: Kurzer ATR reagiert schnell (enger SL), langer ATR stabilisiert (konstanter SL).
- Typische Bereiche 🎛️: 10–21 ist üblich ✅
🛑 SL-Multiplikator (ATR)
- Was es macht 🧠: Definiert die Stop-Loss-Distanz in ATR-Einheiten.
- Long 🟢:
SL = Low - ATR * Mult - Short 🔴:
SL = High + ATR * Mult - Effekt 🎯: Höherer Multiplikator = weiterer SL (weniger Stops, größeres Risiko); niedriger = engerer SL (mehr Stops).
- Typische Werte 🎛️: 0,3–2,0 je nach Volatilität 🌪️
⚖️ Risk:Reward (R:R)
- Was es macht 🧠: Multipliziert die „Risiko“-Distanz zur Berechnung des finalen TP.
- Formel 📌:
-
- Risiko = |Einstieg − SL|
- Finaler TP = Einstieg ± Risiko × RR 🎯
- Zwischen-TPs 🟢: TP1 bei 1R, TP2 bei 2R, … bis
floor(RR)-1 - Beispiel 🧪: RR=3 ➜ TP1 (1R), TP2 (2R), finaler TP (3R) 🎯🎯🎯
✅ Kerzenbestätigung erforderlich
- Was es macht 🧠: Fügt eine Validierung der Kerzenrichtung auf dem Signalbalken hinzu.
- KAUF 🟢: erfordert Close > Open
- VERKAUF 🔴: erfordert Close < Open
- Effekt 🧽: Filtert schwache Umkehrungen heraus, reduziert Rauschen, kann später eintreten ⏳
📌 EMAs Anzeige
👁️ Schnellen EMA anzeigen
- Was es macht 🧠: Zeigt/versteckt die schnelle EMA-Linie.
- Anwendungsfall 💡: Verstecken, wenn Sie ein sauberes Chart wünschen 🧼
👁️ Langsamen EMA anzeigen
- Was es macht 🧠: Zeigt/versteckt die langsame EMA-Linie.
- Anwendungsfall 💡: Sichtbar halten für Trendkontext 🧭
🎛️ Visuelle Steuerung (Clutter-Management) 🧹✨
🚦 Signale anzeigen
- Was es macht 🧠: Zeigt/versteckt KAUF/VERKAUF-Marker.
- Enthält 🧷: KAUF 🟢 / VERKAUF 🔴 Marker (nur)
- Tipp 💡: Deaktivieren für „nur Linien“-Modus 📏
🏷️ TP-Beschriftungen anzeigen
- Was es macht 🧠: Zeigt/versteckt Beschriftungen wie TP1, TP2…
- Effekt 🧼: Ausschalten entfernt viel Textlärm auf höheren TFs 📉
- Hinweis 🧷: Beschriftungen erscheinen nur einmal pro TP-Treffer ✅
⚠️ Ungültigkeitsmarkierungen anzeigen
- Was es macht 🧠: Zeigt/versteckt INV KAUF / INV VERKAUF Marker.
- Anwendungsfall 🧠: Nützlich, wenn Sie Signalumkehrungen studieren möchten 🔁
🎯🛑 Finale TP/SL-Markierungen anzeigen
- Was es macht 🧠: Zeigt/versteckt finale TP- und SL-Marker.
- Anwendungsfall 📒: Ideal zur Überprüfung der Ergebnisverteilung 🎲
📏 Risiko-Linien anzeigen (Einstieg/SL/TP)
- Was es macht 🧠: Zeichnet Einstieg 🏁, SL 🛑, finalen TP 🎯 Linien im Chart.
- Effekt 📌: Visualisiert die virtuelle Handelsstruktur sofort 🧠
🟢 Zwischen-TP-Linien anzeigen
- Was es macht 🧠: Zeichnet gepunktete Linien für TP1/TP2/... Level.
- Tipp 🧼: Deaktivieren, wenn das Chart zu „grünem Spaghetti“ wird 🍝🟢
📌 Letzte Risiko-Linien behalten
- Was es macht 🧠: Hält die letzten Einstiegs-/SL-/TP-Linien nach virtuellem Ausstieg (TP/SL) sichtbar.
- Warum es nützlich ist 📒: Perfekt für Journaling & Nachhandelsanalyse 🧑🔬✅
🧾 Max. Marker im Chart (0=unbegrenzt)
- Was es macht 🧠: Begrenzt, wie viele Textobjekte der Indikator im Chart belässt.
- Wie es funktioniert ♻️: Wenn das Limit überschritten wird, werden die ältesten Marker automatisch entfernt.
- Empfohlen 🎛️: 80–200 je nach Zeitrahmen und Historientiefe 🕰️
🧾 Info-Panel anzeigen
- Was es macht 🧠: Zeigt ein kompaktes Statuspanel im Chart an.
- Zeigt 📋: Status (LONG/SHORT/Keine Position), Einstieg, SL, TP, berechnetes RR.
Zusammenfassung
The indicator simulates virtual trades by setting entry price, stop loss, and take profit levels using Average True Range (ATR) for volatility-based risk sizing combined with a configurable risk-to-reward multiplier. It tracks intermediate take profit levels and monitors price action bar-by-bar to mark virtual trade outcomes without placing actual orders.
Key features include optional candle confirmation for signals, multi-instance support to run multiple configurations on the same chart, and visual clutter controls such as limiting markers and toggling display of EMAs, signals, and risk lines. An info panel provides a compact status overview of virtual positions. Parameters allow customization of EMA periods, ATR period, stop loss multiplier, and risk-reward ratio to adapt to different trading styles and market conditions.
Supported markets include Forex, indices, commodities, stocks, and cryptocurrencies, with symbols like GBPUSD, EURUSD, XAUUSD, NAS100, and BTCUSD among the tagged assets.
Kundenbewertungen
5 | 75 % | |
4 | 25 % | |
3 | 0 % | |
2 | 0 % | |
1 | 0 % |