
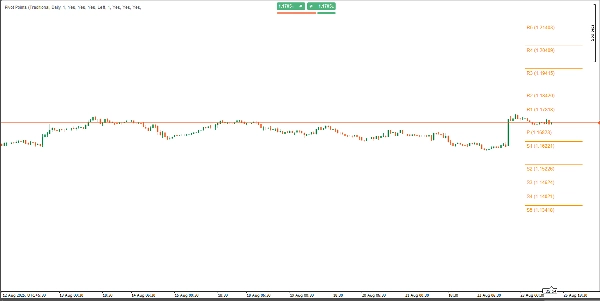
Pivot Point Daily Indicator
Indikator
14 käufe
Version 2.0, May 2026
Windows, Mac
4.2
Bewertungen: 4
Beschreibung
Hauptmerkmale:
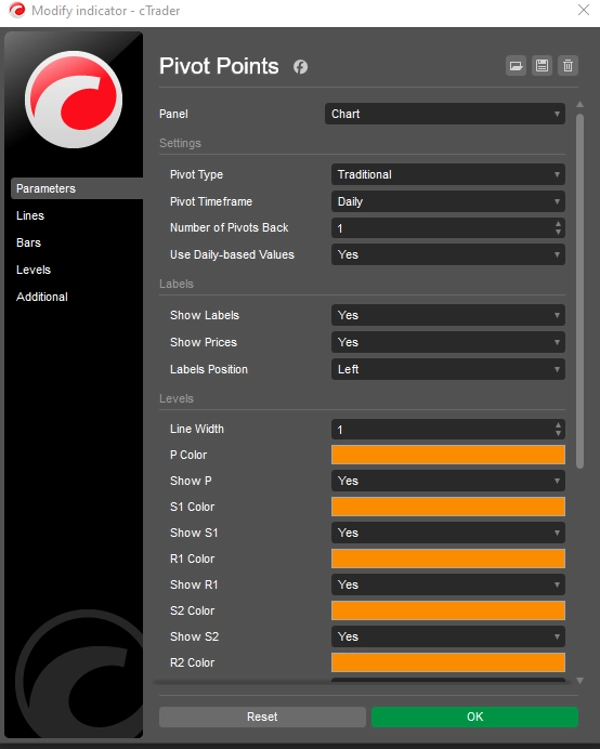
- Mehrere Pivot-Stile: Wechseln Sie nahtlos zwischen sechs Pivot-Berechnungsmethoden: Klassisch, Fibonacci, Woodie, Camarilla, DM und Traditionell. Jede Methode unterstützt unterschiedliche Ebenen (bis zu R5/S5 für Traditionell und Camarilla, R3/S3 für Fibonacci und P/R1/S1 für DM).
- Flexible Zeitrahmen: Wählen Sie aus einer breiten Palette von Pivot-Zeiträumen, einschließlich Auto, Täglich, Wöchentlich, Monatlich, Vierteljährlich, Jährlich und mehrjährigen Optionen (halbjährlich, dreijährlich, fünfjährlich, zehnjährlich). Perfekt, um sich an Ihren Handelszeitraum anzupassen.
- Historische Pivot-Steuerung: Legen Sie mit dem Parameter Anzahl der zurückliegenden Pivots fest, wie viele historische Pivot-Sets angezeigt werden sollen (1–200), um ein übersichtliches Chart zu gewährleisten und gleichzeitig wichtige historische Ebenen zu erhalten.
- Anpassbares Erscheinungsbild: Vollständig anpassbare Farben, Linienbreiten und Beschriftungseinstellungen. Schalten Sie Beschriftungen und Preiswerte ein/aus und wählen Sie die Position der Beschriftungen (links oder rechts) mit intelligenten vertikalen Versätzen für bessere Übersichtlichkeit.
- Tages- oder Intraday-Daten: Option zur Verwendung von tagesbasierten Werten oder Daten des Chart-Zeitrahmens, was Flexibilität für verschiedene Handelsstrategien bietet.
- Optimierte Leistung: Leichter, nativer cTrader-Code sorgt für schnelle, Echtzeit-Updates ohne Verzögerung, kompatibel mit Forex, Indizes, Rohstoffen, Krypto und mehr.
Warum Pivot Points Standard wählen?
- Vielseitiges Handelswerkzeug: Identifizieren Sie wichtige Unterstützungs-/Widerstandsniveaus, Trendrichtungen und Ausbruchsmöglichkeiten in jedem Markt oder Zeitrahmen.
- Benutzerfreundliche Oberfläche: Intuitive Dropdown-Menüs für Pivot-Typ, Zeitrahmen und Beschriftungsposition machen die Anpassung kinderleicht.
- Historische Analyse: Visualisieren Sie bis zu 200 historische Pivot-Sets, um vergangene Preisinteraktionen zu studieren und Ihre Strategie zu verfeinern.
- Sauberes Charting: Intelligente Beschriftungspositionierung und anpassbare Linienlängen verhindern Chart-Überladung und verbessern die Lesbarkeit.
Anleitung zur Verwendung:
- Wenden Sie den Indikator auf Ihr cTrader-Chart an.
- Wählen Sie Ihren bevorzugten Pivot-Typ (z. B. Fibonacci, Camarilla) und Pivot-Zeitrahmen (z. B. Täglich, Monatlich).
- Passen Sie die Anzahl der zurückliegenden Pivots an, um die angezeigten historischen Sets zu steuern.
- Passen Sie Farben, Linienbreiten und Beschriftungseinstellungen an Ihren Stil an.
- Verwenden Sie Pivot-Ebenen, um Unterstützung/Widerstand zu identifizieren, Stop-Loss/Take-Profit zu setzen oder Ausbrüche zu handeln.
Ideal für:
- Daytrader: Nutzen Sie tägliche oder wöchentliche Pivots für Intraday-Einstiege und -Ausstiege.
- Swing-Trader: Verwenden Sie monatliche oder vierteljährliche Pivots, um längerfristige Trends zu erfassen.
- Scalper: Kombinieren Sie mit niedrigeren Zeitrahmen für schnelle, präzise Trades.
- Alle Märkte: Funktioniert nahtlos über Forex, Aktien, Krypto und Rohstoffe hinweg.
Steigern Sie Ihr Handelsvertrauen
Mit Pivot Points Standard erhalten Sie Zugang zu einem leistungsstarken All-in-One-Tool, das die technische Analyse vereinfacht und Ihre Fähigkeit verbessert, Handelsmöglichkeiten mit hoher Wahrscheinlichkeit zu erkennen. Egal, ob Sie Anfänger oder erfahrener Trader sind, dieser Indikator passt sich Ihrer Strategie an und liefert klare, umsetzbare Niveaus, um Ihr Trading auf das nächste Level zu heben. Probieren Sie Pivot Points Standard noch heute aus und übernehmen Sie die Kontrolle über Ihr Trading mit Präzision und Klarheit! Einmalige Zahlung. Lebenslanger Zugang. Zukünftige Updates inklusive.
Zusammenfassung
KI-Zusammenfassung
Pivot Point Daily Indicator is a multi-timeframe pivot point tool designed for the cTrader platform. It supports six pivot calculation methods—Classic, Fibonacci, Woodie, Camarilla, DM, and Traditional—each offering various resistance and support levels (up to R5/S5 for some methods). Users can select from a broad range of timeframes including Auto, Daily, Weekly, Monthly, Quarterly, Yearly, and multi-year intervals, allowing alignment with different trading horizons.
The indicator allows displaying up to 200 historical pivot sets to analyze past price interactions while maintaining chart clarity through customizable label positions and line settings. It offers options to use daily-based or intraday data, enhancing flexibility for diverse trading strategies.
Pivot Point Daily Indicator is optimized for real-time performance with native cTrader coding, compatible across Forex, indices, commodities, cryptocurrencies, and other markets. Its interface includes intuitive dropdown menus for pivot type, timeframe, and label customization.
Traders can use this indicator to identify key support and resistance levels, trend directions, and breakout opportunities, aiding in setting stop-loss and take-profit points. It suits various trading styles including day trading, swing trading, and scalping across multiple asset classes.
Indikatorprofil
Indikatorkategorie
Unterstützung und Widerstand
Ausgabetyp
Filter
Datenanforderungen
Nur Balken
Unterstützte Signale
Level – Durchbrechen
Kundenbewertungen
4.2
Bewertungen: 4
5 | 25 % | |
4 | 75 % | |
3 | 0 % | |
2 | 0 % | |
1 | 0 % |
Kundenbewertungen
May 2, 2026
Bought it, added it, used it for a while, and now it's disappeared, and I cannot get it back!
August 28, 2025
Good helper for review if the trader wants it keeps attention on levels that actually matter. It works best as support, not a final decision maker. The cleanest use is 3 to 5 levels per chart, with 0.5 pullbacks checked before entry. not every zone holds, even if it looks clean.
August 27, 2025
August 27, 2025
Usable tool with purpose for traders who build plans around market levels. It gives value around key price zones, but not every zone holds, even if it looks clean. I would wait for 2 reactions and avoid trades where the target is less than 1.5R. Levels are useful when they reduce noise, not when they crowd the chart.
Diskussion
Häufig gestellte Fragen (FAQ)
Fibonacci
Prop
Forex
Breakout
Indices
Commodities
Über den cTrader Store verfügbare Produkte, einschließlich Handelsbots, Indikatoren und Plugins, werden von externen Entwicklern bereitgestellt und nur zu Informations- und technischen Zugriffszwecken verfügbar gemacht. cTrader Store ist kein Broker und erbringt keine Anlageberatung, persönlichen Empfehlungen oder eine Garantie für zukünftige Performance.


![„[Hamster-Coder] Pivot Points MTF“-Logo](https://cdn.ctrader.com/image/webp/4c143e5a-309c-40e3-a578-f04d1e133ffa_31159)


Preis
Seit 30/05/2025
40
Verkäufe