
Descripción
Presentamos Stochastic RSI PRO para cTrader, una versión avanzada del Stochastic RSI indicador diseñado para mejorar tu precisión en el trading.
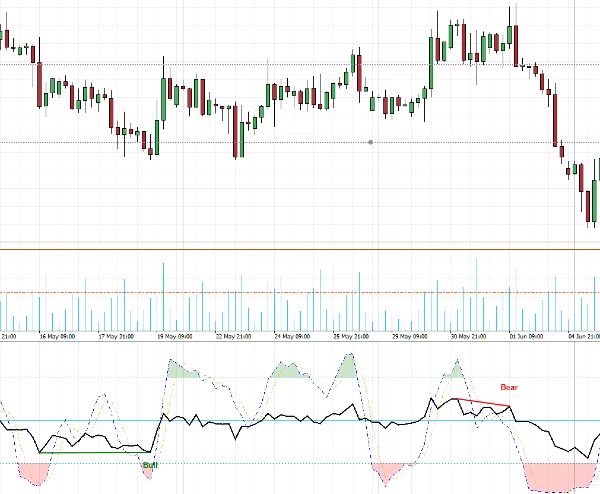
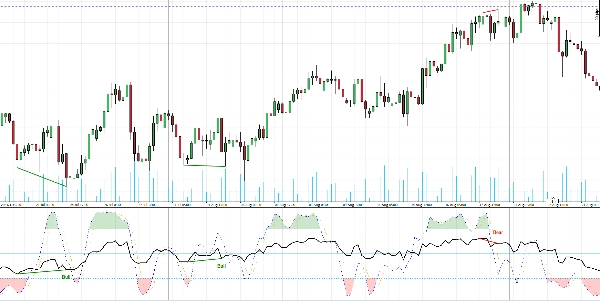
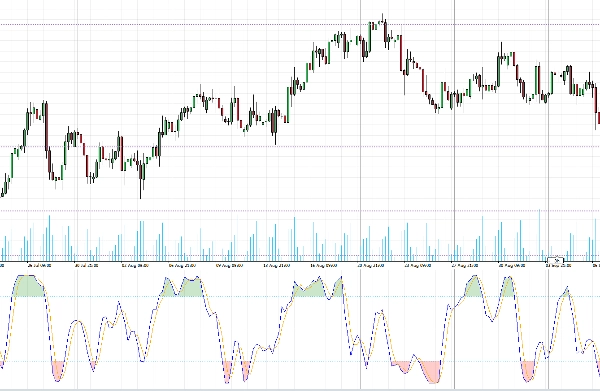
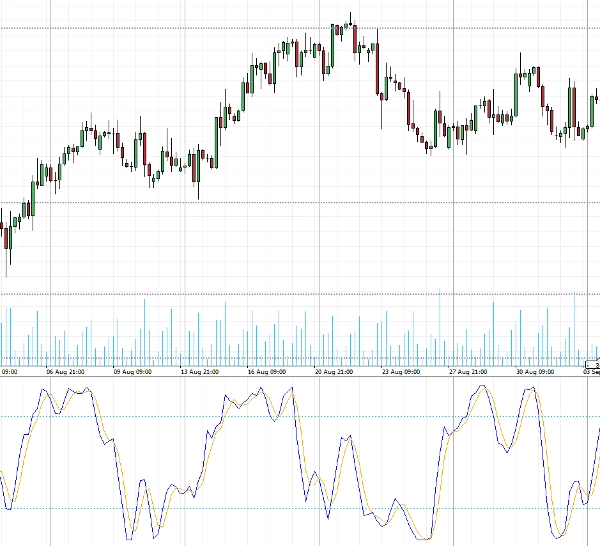
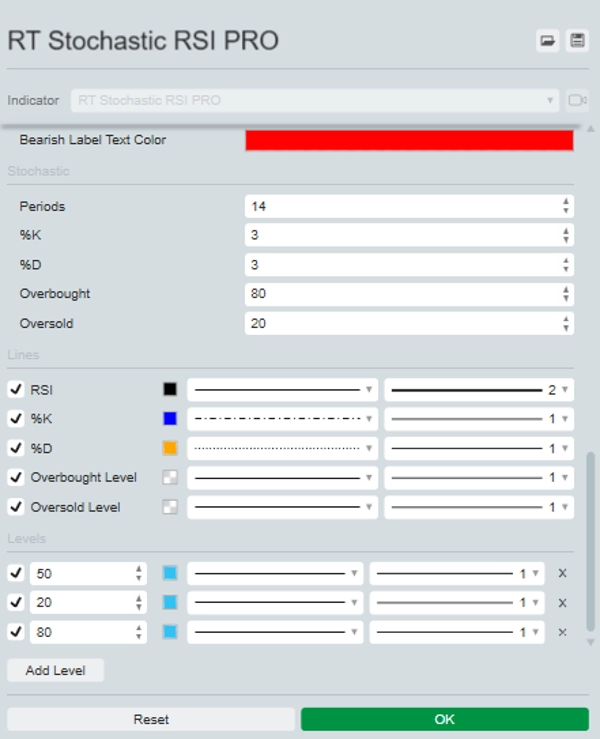
Esta poderosa herramienta superpone el RSI directamente sobre el Stochastic RSI, proporcionando una vista completa del impulso del mercado. Resalta las zonas de sobrecompra y sobreventa con colores distintivos para una fácil identificación.
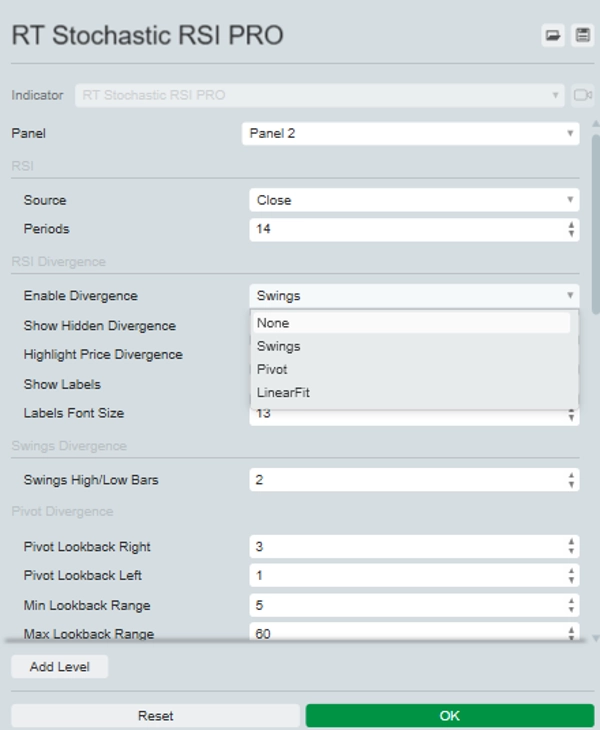
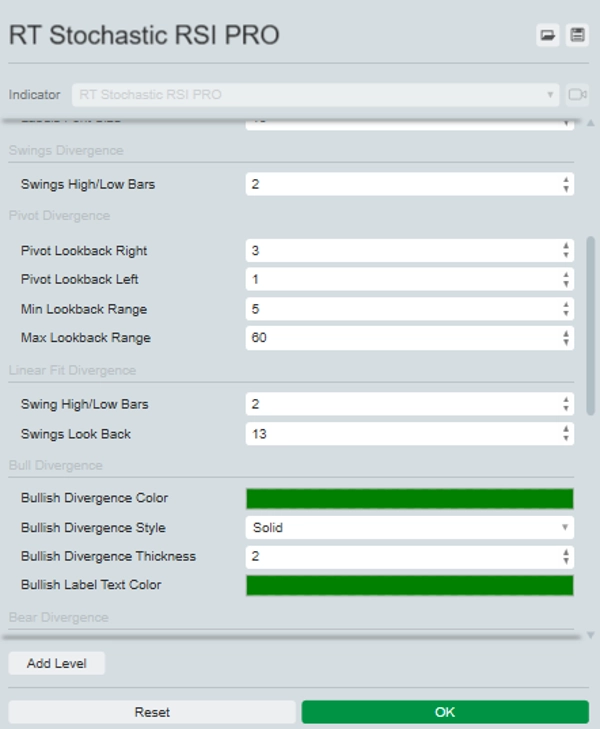
La característica destacada de Stochastic RSI PRO es su capacidad para identificar y opcionalmente resaltar tanto las divergencias regulares como las ocultas en el gráfico. Puedes elegir entre tres métodos para identificar divergencias: Swing, Pivot o Linear Fit, cada uno con configuraciones personalizables para adaptarse a tu estrategia de trading.
Eleva tu análisis y toma de decisiones con Stochastic RSI PRO, una herramienta imprescindible para traders exigentes.


