Descripción
Index Hunter: Resumen
Index Hunter es un indicador técnico especializado y un sistema de apoyo a la decisión diseñado principalmente para índices de alta volatilidad como US30 (Dow Jones) y NAS100 (Nasdaq). A diferencia de los indicadores estándar que solo muestran datos pasados, Index Hunter se centra en "Predicción Vectorial"—intentando proyectar dónde es probable que esté el precio 4 velas en el futuro basándose en la velocidad actual (pendiente) a través de múltiples marcos temporales.
1. Mecánica Central (Cómo Funciona)
A. El Motor de Pronóstico "Vector"
Este es el corazón de la herramienta. No solo observa el precio actual; calcula la tasa de cambio (Pendiente) a través de los marcos temporales M5, M15 y H1 para dibujar un "Camino Futuro" en tu gráfico.
- Mecánica: Calcula un promedio ponderado del impulso de diferentes marcos temporales para proyectar 4 puntos (P1, P2, P3, P4) en el futuro.
- Visual: Ves un camino coloreado (Cian -> Amarillo -> Naranja) que se extiende a la derecha del precio, visualizando la inercia del mercado.
- Camino Fantasma: También recuerda la predicción anterior (Camino Fantasma) para que puedas ver si el mercado está respetando las proyecciones pasadas del algoritmo (una "verificación de realidad").
B. Sistema Visual Multicapa
Superpone automáticamente niveles institucionales críticos:
- Puntos Pivote (Flexibles): Calcula automáticamente los niveles Pivot, R1/S1 y R2/S2 basados en un marco temporal seleccionable (H12, Diario, Día2 o Día3).
- Niveles Psicológicos: Dibuja "Líneas Psicológicas" en cada intervalo de 100 puntos (por ejemplo, 34000, 34100), que a menudo actúan como zonas magnéticas para los índices.
- Máximo/Mínimo Diario: Marca el rango del día anterior para mostrar zonas de ruptura o rechazo.
- Fractales: Identifica máximos y mínimos locales con flechas (▲ ▼) para una colocación precisa de entrada/stop-loss.
C. Lógica de "Confianza" y Viabilidad
La herramienta no solo da una señal; la califica.
- Cálculo: Mide la distancia a tu objetivo de ganancia y la compara con la energía actual del mercado (ATR - Rango Verdadero Promedio).
- Resultado:
-
- CALIENTE (>80%): Impulso fuerte + distancia razonable al objetivo.
- TIBIO (50-80%): Configuración moderada.
- FRÍO (<50%): El mercado asume baja probabilidad de alcanzar el objetivo (por ejemplo, el objetivo está demasiado lejos para la volatilidad actual).
D. Mecánica del "Escudo" de la Cuenta
Incluye un gestor de riesgo pasivo en el panel:
- Métrica de Resistencia: Calcula cuántos "puntos" el mercado puede moverse en tu contra antes de que tu cuenta esté en peligro, basado en tu saldo y tamaño mínimo de lote.
- Estado: Muestra "🛡️ ESCUDO DEL ÍNDICE: ACTIVADO" si tu cuenta está segura en relación con la volatilidad actual (ATR), o "⚠️ MARGEN BAJO" si la volatilidad es demasiado alta para tu saldo.
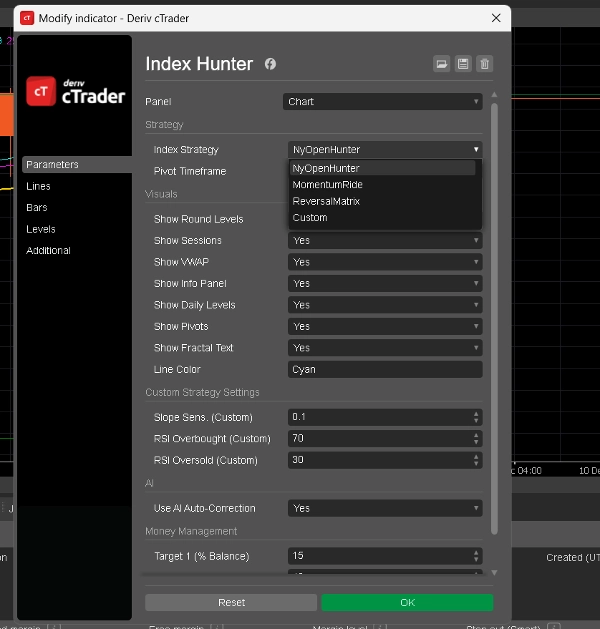
2. Modos Disponibles (Estrategias)
Puedes cambiar entre estos modos en la configuración del indicador (
Index Strategy
parámetro). Cada modo cambia cómo la IA interpreta el mercado.
1. Modo: NyOpenHunter (Scalper de Nueva York)
- Ideal Para: Las caóticas primeras 2-3 horas de la apertura del mercado de EE.UU.
- Lógica:
-
- Horario Activo: 13:00 - 17:00 UTC (aprox.).
- Disparador: Busca una Pendiente M5 mayor que 0.1 (o menor que -0.1).
- Filosofía: "Captura la explosión." Espera el estallido inicial de volumen en la campana de NY y señala para montar esa ola específica.
- Sentimiento del Panel: Muestra "NY OPEN BUY 🚀" o "NY OPEN SELL 🔻".
2. Modo: MomentumRide (Seguidor de Tendencia)
- Ideal Para: Tendencias fuertes y sostenidas fuera de la apertura.
- Lógica:
-
- Disparador: Requiere una Pendiente M5 más fuerte (> 0.2) que el modo NY.
- Filosofía: "No te dejes cortar." Ignora movimientos débiles y solo señala cuando el mercado se mueve con convicción significativa.
- Sentimiento del Panel: Muestra "MOMENTUM UP 🟢" o "MOMENTUM DOWN 🔴".
3. Modo: ReversalMatrix (Contratendencia)
- Ideal Para: Mercados laterales o para capturar máximos/mínimos.
- Lógica:
-
- Disparador: Usa RSI (Índice de Fuerza Relativa).
-
- Señal de Venta: RSI > 75 (Sobrecomprado).
- Señal de Compra: RSI < 25 (Sobrevendido).
- Filosofía: "Contrarresta los extremos." Identifica cuando la banda elástica está demasiado estirada y es probable que se retraiga.
- Sentimiento del Panel: "SOBRECOMPRADO (VENDER PRONTO)" o "SOBREVENDIDO (COMPRAR PRONTO)".
4. Modo: Personalizado (Definido por el Usuario)
- Ideal Para: Usuarios avanzados que desean ajustar el bot.
- Lógica: Te permite establecer tus propios umbrales para Sensibilidad de Pendiente y niveles de RSI en la configuración.
-
- Ejemplo: Puedes crear una estrategia híbrida que solo compre si la Pendiente > 0.05 Y RSI < 40.
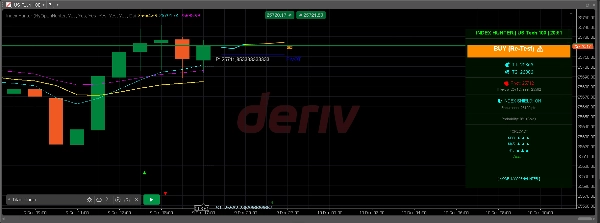
3. El "Panel de Información" (Pantalla de Visualización)
El panel visual en el lado derecho del gráfico consolida todos estos datos:
- Encabezado: Muestra el modo actual y el símbolo.
- Preferencia: El sesgo principal de la IA (por ejemplo, "BUY 34150 ▲").
- Objetivos (T1, T2): Objetivos de ganancia dinámicos calculados según la configuración porcentual de tu cuenta y la volatilidad.
- Pronóstico: Un análisis secuencial de las tendencias M30, M45 y H1 (por ejemplo, "M30: ▲ ▲ ▲" significa alineación fuerte de compra).
- Probabilidad: La puntuación de confianza de la IA (Caliente/Tibio/Frío).
Resumen
Key features include an automatic overlay of institutional levels such as pivot points (with selectable timeframes), psychological price levels at 100-point intervals, previous day’s high/low, and fractals marking local tops and bottoms. It incorporates a confidence grading system (Hot, Warm, Cold) based on momentum strength and volatility relative to profit target distance.
Index Hunter includes a risk management "Shield" that assesses account safety by calculating potential adverse market moves against account balance and lot size, displaying status alerts accordingly.
The indicator offers four operational modes: NyOpenHunter (New York market open scalping), MomentumRide (trend following), ReversalMatrix (counter-trend using RSI), and a Custom mode for user-defined slope and RSI thresholds. A comprehensive info panel consolidates mode, bias, dynamic targets, trend forecasts, and confidence scores for decision support.
Valoraciones de clientes
5 | 67 % | |
4 | 33 % | |
3 | 0 % | |
2 | 0 % | |
1 | 0 % |