Description
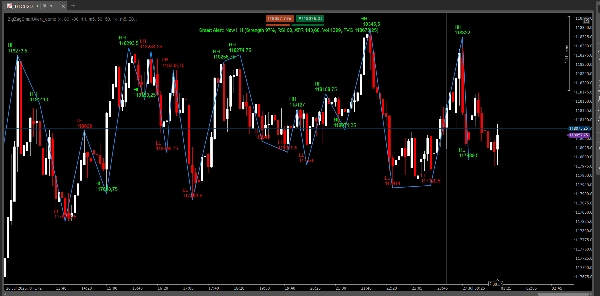
ZigZag Smart Alert DEMO pour cTrader
VERSION DÉMO – Essai gratuit de 24 heures !
Ceci est une version DÉMO de l'indicateur ZigZag Smart Alert pour cTrader.
Vous pouvez utiliser toutes les fonctionnalités pendant 24 heures après l'installation.
Après la période d'essai, l'indicateur expirera et affichera un message.
Pour obtenir la version complète, recherchez "ZigZag Smart Alert" dans le cTrader Store.
Caractéristiques principales :
- Alertes Multi-Filtres Intelligentes :
-
- Recevez des alertes sonores et/ou visuelles uniquement lorsqu'un nouveau swing (HH/LL) apparaît et que tous vos filtres personnalisés sont remplis (force des chandeliers, RSI, ATR, volume, FVG).
- Les flèches d'entrée vous montrent exactement où le signal est survenu.
- Structure ZigZag Classique :
-
- Détecte et étiquette tous les sommets et creux (HH, HL, LH, LL) avec des couleurs et une taille de police personnalisables.
- Sensibilité et épaisseur de ligne réglables.
- Intégration du Fair Value Gap (FVG) :
-
- Alertes uniquement lorsqu'un swing est confirmé par une clôture de prix au-dessus/en dessous du FVG le plus proche.
- Filtres RSI, ATR, Volume :
-
- Définissez vos propres seuils et périodes pour le RSI et l'ATR.
- Filtrez les signaux par la force des chandeliers et le volume des ticks.
- Exporter les Swings en CSV :
-
- Enregistrez tous les swings détectés (index, heure, type, prix) dans un fichier CSV pour une analyse ou un journal ultérieur.
- Facile à utiliser, entièrement personnalisable :
-
- Tous les paramètres sont disponibles dans le panneau de configuration.
- Fonctionne sur n'importe quel instrument et période.
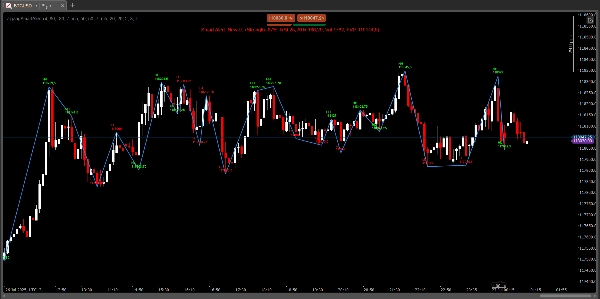
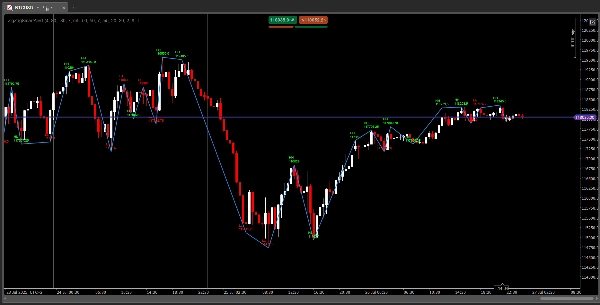
Comment ça fonctionne :
- L'indicateur analyse le graphique pour détecter les hauts et bas locaux selon la sensibilité choisie.
- Chaque swing est étiqueté comme HH, HL, LH ou LL, et relié par une ligne ZigZag.
- Lorsqu'un nouveau HH ou LL apparaît et que toutes les conditions de filtre sont remplies, vous recevez une alerte sonore et/ou visuelle instantanée, et une flèche d'entrée est dessinée sur le graphique.
- Tous les swings peuvent être exportés dans un fichier CSV pour vos archives.
Paramètres recommandés pour différents styles de trading :
Scalping (ex. M1, M5) :
- Sensibilité ZigZag : 4
- Période RSI : 7
- Période RSI : M5
- Seuils RSI : 80/20
- Période ATR : 7
- Période ATR : M1
Daytrading (ex. M15, M30) :
- Sensibilité ZigZag : 4
- Période RSI : 14
- Période RSI : M15
- Seuils RSI : 70/30
- Période ATR : 14
- Période ATR : M15
Swing trading (ex. H1, H4) :
- Sensibilité ZigZag : 4
- Période RSI : 14–21
- Période RSI : H4
- Seuils RSI : 70/30
- Période ATR : 14
- Période ATR : H4
Vous pouvez ajuster ces paramètres pour adapter votre propre stratégie et les conditions du marché.
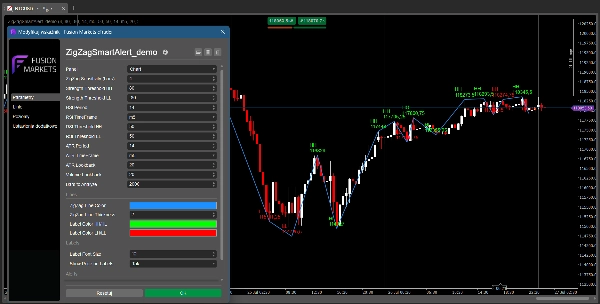
Paramètres :
- Sensibilité ZigZag (barres)
- Seuils de force (pour HH/LL)
- Période & Période RSI, Seuils RSI
- Période & Période ATR, Lookback ATR
- Lookback Volume
- Couleur & Épaisseur de la ligne ZigZag
- Couleurs des étiquettes & Taille de la police
- Afficher le prix sur les étiquettes (oui/non)
- Barres à analyser
- Activer les alertes sonores (oui/non)
- Activer les alertes visuelles (oui/non)
- Activer l'exportation en CSV (oui/non)
Pourquoi choisir ZigZag Smart Alert ?
- Recevez uniquement les meilleurs signaux – plus de bruit, seulement des configurations à haute probabilité.
- Parfait pour les stratégies price action, SMC, ICT et swing trading.
- Voyez exactement où entrer – avec des flèches d'entrée et un contexte complet.
- Facile à utiliser, entièrement personnalisable et aspect professionnel.
Essayez ZigZag Smart Alert et faites passer votre swing trading au niveau supérieur !
Autres indicateurs de cet auteur :
- Candle Timer & Strength DEMO
- Candle Timer & Strength FULL
- Candle Timer & Strength Panel
- FVG MultiTF Tracker
- ZigZag Pro DEMO (ajoutez votre lien)
- ZigZag Pro FULL (ajoutez votre lien)
📩 Questions ? Suggestions ? Remise ?
Contact disponible dans mon profil : Robikobud
https://ctrader.com/pl?search=kobud.222&u=kobud.222
http://www.youtube.com/@Robi22-22