
Candle Timer & Strength Demo
Wskaźnik
268 pobrania
Wersja 1.0, Jul 2025
Windows, Mac
Opis
Kluczowe cechy:
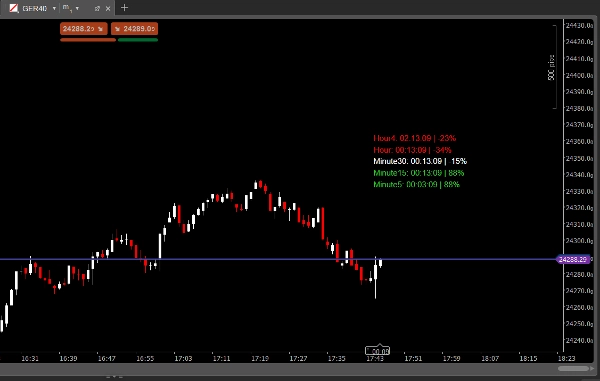
- Timery świec na wielu interwałach czasowych:
Zobacz odliczanie do zamknięcia następnej świecy na maksymalnie 5 wybranych interwałach, wszystko w jednym przejrzystym panelu. - Siła świecy w %:
Natychmiast zobacz siłę bieżącej świecy (od -100% do +100%) dla każdego interwału, na podstawie położenia zamknięcia względem zakresu świecy. - Konfigurowalny panel:
-
- Ustaw rozmiar czcionki, odległość od ostatniej świecy oraz odstępy pionowe.
- Wybierz preferowane interwały czasowe (M1, M5, M15, M30, H1, H4 itd.).
- Kolory zmieniają się automatycznie: zielony dla silnego trendu wzrostowego, czerwony dla silnego trendu spadkowego, biały dla neutralnego.
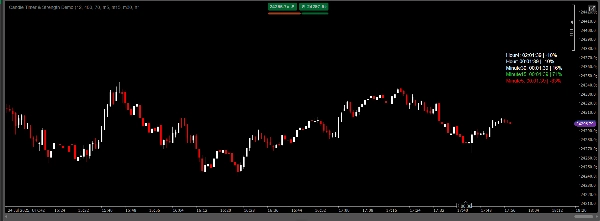
- Zawsze widoczny:
Panel jest zawsze widoczny na Twoim wykresie, co ułatwia szybkie monitorowanie czasu i momentum rynku. - Idealny dla:
-
- Skalperów i daytraderów potrzebujących precyzyjnego timingu świec.
- Traderów korzystających z wielu interwałów, którzy chcą widzieć momentum i timing w jednym miejscu.
- Każdego, kto chce poprawić swoje umiejętności wejścia/wyjścia i czytania świec.
Jak to działa:
- Wskaźnik oblicza czas pozostały do zamknięcia bieżącej świecy dla każdego wybranego interwału.
- Oblicza także siłę świecy jako procent:
-
- +100% = zamknięcie na samym szczycie świecy (silny trend wzrostowy)
- -100% = zamknięcie na samym dole (silny trend spadkowy)
- 0% = zamknięcie na środku (neutralny)
- Panel aktualizuje się w czasie rzeczywistym i jest w pełni konfigurowalny.
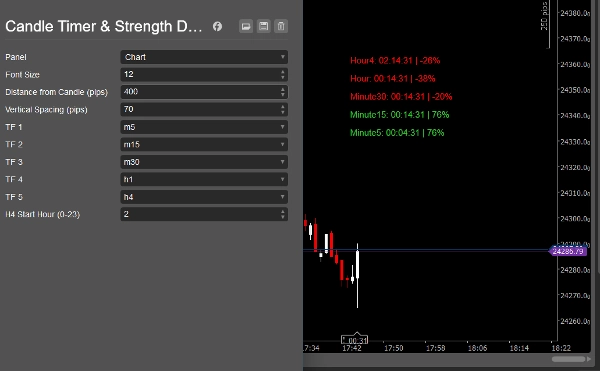
Parametry:
- Rozmiar czcionki
- Odległość od świecy (pipsy)
- Odstępy pionowe (pipsy)
- Interwały 1–5 (niestandardowe)
- Godzina startu H4 (dla brokerów z niestandardowymi świecami H4)
Dlaczego warto wybrać Candle Timer & Strength?
- Oszczędzaj czas: Nie musisz już zmieniać interwałów ani liczyć zamknięć świec w głowie.
- Handluj z pewnością: Natychmiast zobacz, czy rynek zyskuje czy traci momentum.
- Profesjonalny wygląd: Czysty, nowoczesny panel pasuje do każdego stylu wykresu.
- Łatwy w użyciu: Plug & play, bez potrzeby kodowania.
Uwaga:
Ta wersja demo służy wyłącznie do celów oceny.
Jeśli podoba Ci się wskaźnik, proszę zakup pełną wersję dla nieograniczonego użytkowania.
Aby uzyskać pełną wersję, wyszukaj "Candle Timer & Strength" w sklepie cTrader.
Zobacz wszystkie moje wskaźniki i boty:
https://ctrader.com/pl?search=kobud.222&u=kobud.222
http://www.youtube.com/@Robi22-22
📩 Pytania? Sugestie? Rabat?
Kontakt dostępny w moim profilu: Robikobud
Podsumowanie
Podsumowanie AI
Candle Timer & Strength Demo for cTrader is an indicator designed to display real-time countdowns to the close of current candles across up to five customizable timeframes. It provides a clear panel showing the remaining time until candle close and the candle’s strength as a percentage, ranging from -100% (strong bearish) to +100% (strong bullish), based on the candle’s close position relative to its range. The panel is fully customizable, allowing users to adjust font size, vertical spacing, distance from the last candle, and select preferred timeframes such as M1, M5, M15, M30, H1, and H4. Colors dynamically indicate momentum: green for strong bullish, red for strong bearish, and white for neutral. The panel remains always visible on the chart, facilitating quick assessment of market timing and momentum. This tool is suited for scalpers, day traders, and multi-timeframe traders seeking precise candle timing and momentum insights to improve entry and exit decisions. Parameters include font size, spacing, timeframe selection, and H4 start hour adjustment for brokers with non-standard candle timings. This demo version is intended for evaluation purposes.
Profil wskaźnika
Opinie klientów
0.0
Opinie: 0
Opinie klientów
Ten produkt nie ma jeszcze opinii. Wypróbowałeś(-aś) go już? Bądź pierwszy(-a) i powiedz o tym innym!
Dyskusja
Częste pytania
Produkty dostępne za pośrednictwem cTrader Store, w tym boty handlowe, wskaźniki i wtyczki, dostarczane są przez deweloperów zewnętrznych i udostępniane wyłącznie w celach informacyjnych oraz w celu zapewnienia dostępu technicznego. cTrader Store nie jest brokerem i nie zapewnia doradztwa inwestycyjnego, nie udziela spersonalizowanych rekomendacji ani nie gwarantuje przyszłych wyników.
Więcej od tego autora


Cena
Od 31/12/2024
7
Sprzedaż
1.14K
Bezpłatne instalacje