
Opis
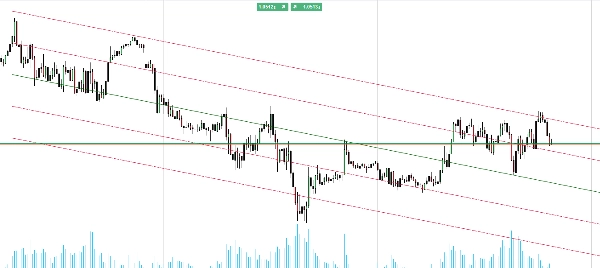
Przedstawiamy wskaźnik Kanał Odchylenia Standardowego dla cTrader, potężne narzędzie zaprojektowane, aby pomóc Ci precyzyjnie wizualizować trendy rynkowe.
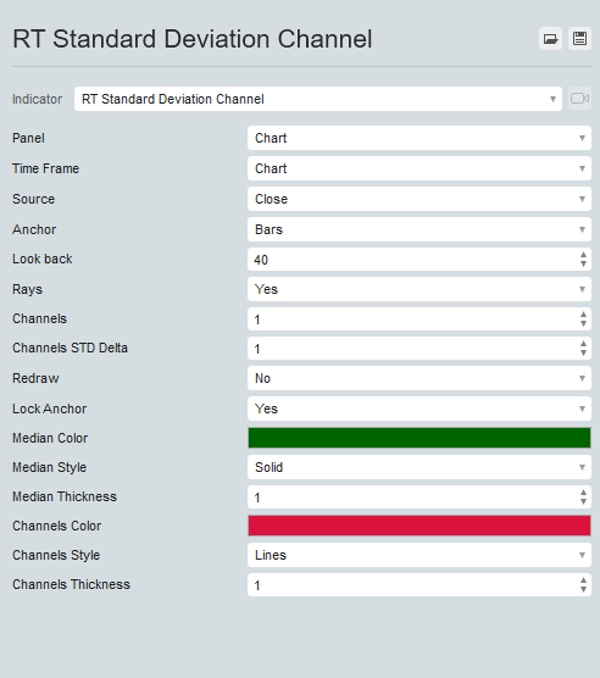
Ten wskaźnik wyświetla medianę określonego okresu na Twoim wykresie, zapewniając centralny punkt odniesienia dla ruchów cen.
Dodatkowo pozwala dodać żądaną liczbę górnych i dolnych kanałów w wielokrotnościach odchylenia standardowego, dając Ci wyraźny obraz zmienności cen i potencjalnych stref wybicia.
Idealny dla traderów poszukujących zaawansowanych możliwości analitycznych, wskaźnik Kanał Odchylenia Standardowego pomaga łatwo identyfikować kierunki trendów i potencjalne punkty zwrotne.
Ulepsz swój zestaw narzędzi handlowych dzięki Kanałowi Odchylenia Standardowego, aby uzyskać lepszą analizę rynku i podejmowanie decyzji.


![Logo „[Stellar Strategies] Market Session Ultimate”](https://cdn.ctrader.com/image/webp/61ffd537-0125-4246-9e72-42eca1791d64_28232)


