
RT Chandelier Exit
Wskaźnik
4 zakupy
Wersja 1.0, Sep 2024
Windows, Mac
Opis
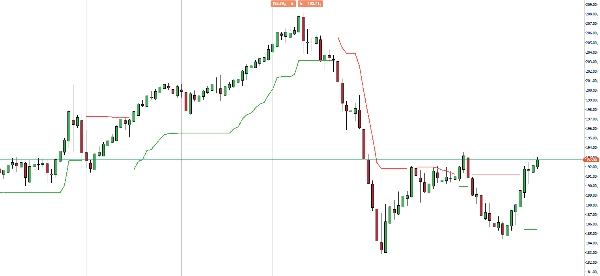
Przedstawiamy wskaźnik Chandelier Exit, Twoje ostateczne narzędzie do optymalizacji wyjść z transakcji z precyzją i pewnością.
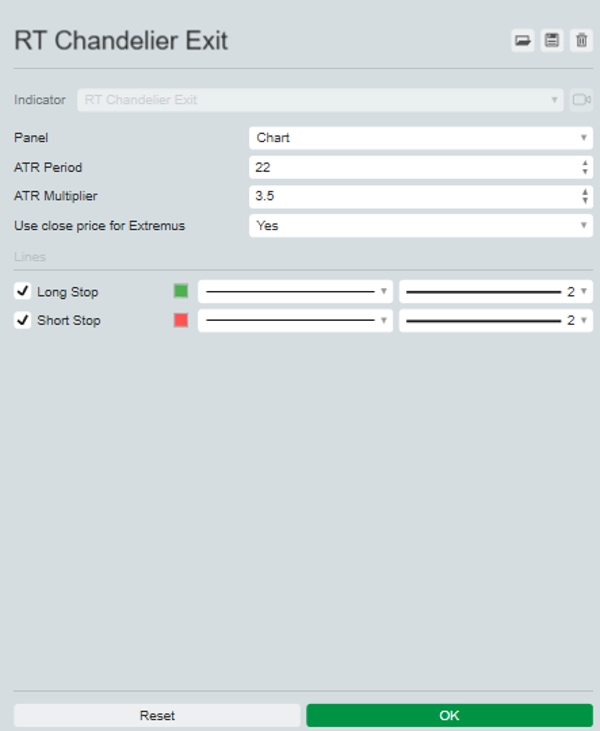
Ten wskaźnik dynamicznie oblicza punkty stop-loss na podstawie najwyższego maksimum i ATR, dostarczając wyraźne wskazówki wizualne na Twoim wykresie w czasie rzeczywistym.
Zaprojketowany, aby pomóc Ci zabezpieczyć zyski i chronić przed odwróceniami rynku, Chandelier Exit zapewnia, że zawsze będziesz o krok przed innymi.
Idealny dla traderów chcących ulepszyć swoją strategię za pomocą niezawodnych sygnałów wyjścia, ten wskaźnik oferuje prostą, wizualną metodę zarządzania ryzykiem. Ulepsz swój zestaw narzędzi handlowych i zabezpiecz swoje zyski dzięki Chandelier Exit.
Podsumowanie
Podsumowanie AI
The RT Chandelier Exit indicator dynamically calculates stop-loss levels using the highest high and Average True Range (ATR) to provide real-time visual cues on trading charts. It is designed to help traders optimize trade exits by locking in profits and protecting against market reversals. This indicator supports various markets including Forex, cryptocurrencies, commodities, stocks, and indices, with symbols such as BTCUSD, EURUSD, GBPUSD, XAUUSD, NAS100, and USDJPY. It offers a straightforward, visual approach to risk management, making it suitable for traders seeking reliable exit signals to enhance their trading strategies.
Profil wskaźnika
Opinie klientów
0.0
Opinie: 0
Opinie klientów
Ten produkt nie ma jeszcze opinii. Wypróbowałeś(-aś) go już? Bądź pierwszy(-a) i powiedz o tym innym!
Dyskusja
Częste pytania
BTCUSD
Forex
Signal
Indices
EURUSD
Commodities
GBPUSD
NZDUSD
Prop
Scalping
Crypto
Stocks
XAUUSD
NAS100
ATR
USDJPY
Produkty dostępne za pośrednictwem cTrader Store, w tym boty handlowe, wskaźniki i wtyczki, dostarczane są przez deweloperów zewnętrznych i udostępniane wyłącznie w celach informacyjnych oraz w celu zapewnienia dostępu technicznego. cTrader Store nie jest brokerem i nie zapewnia doradztwa inwestycyjnego, nie udziela spersonalizowanych rekomendacji ani nie gwarantuje przyszłych wyników.


Cena
Od 25/09/2024
20
Sprzedaż