
Opis
ICT Killzones Complete – Profesjonalna analiza sesji handlowych
Opanuj timing instytucjonalnego handlu dzięki najbardziej kompleksowemu wskaźnikowi ICT Killzones dla cTrader. To narzędzie klasy profesjonalnej automatycznie identyfikuje i wizualizuje wszystkie pięć kluczowych sesji handlowych ICT (Inner Circle Trader), dając Ci przewagę w handlu razem z inteligentnym kapitałem.
Co nowego w tej wersji:
- Wszystkie 5 sesji ICT: Pełne pokrycie obejmujące Asian Range, London Kill Zone, New York Kill Zone, NY Lunch/Reversal Zone oraz NY PM Kill Zone
- Inteligentny system kolorów: Proste nazwy kolorów (Czerwony, Niebieski, Pomarańczowy) zamiast skomplikowanych kodów ARGB
- Niezależna kontrola przezroczystości: Regulacja przezroczystości dla każdej sesji (0-100%)
- Kolory etykiet specyficzne dla sesji: Możliwość niezależnej personalizacji kolorów etykiet od kolorów stref
- Opisy sesji: Opcjonalne etykiety informacyjne wyjaśniające cechy każdej sesji
- Ulepszona wydajność: Optymalizowany kod z automatycznym usuwaniem starych stref
Kluczowe funkcje:
📊 Pełne pokrycie sesji:
- Asian Range (19:00-00:00 NY): Identyfikuje strefy konsolidacji i pule płynności do późniejszych ataków
- London Kill Zone (02:00-05:00 NY): Oznacza główne skoki zmienności idealne do łowienia stopów i odwróceń
- NY Kill Zone (07:00-10:00 NY): Podkreśla drugi główny ruch z silnym impetem
- NY Lunch Zone (12:00-13:30 NY): Pokazuje okresy odwrócenia i konsolidacji
- NY PM Kill Zone (13:30-16:00 NY): Rejestruje ruchy wtórne i równoważenie rynku
🎨 Łatwa personalizacja kolorów:
- Proste nazwy kolorów: wystarczy wpisać "Niebieski", "Pomarańczowy", "Fioletowy" itd.
- Ponad 50 predefiniowanych kolorów, w tym DodgerBlue, BlueViolet, MediumAquamarine
- Obsługa kolorów w formacie hex (#RRGGBB)
- Indywidualne suwaki przezroczystości (0-100%) dla każdej strefy
- Oddzielne kolory etykiet dla maksymalnej czytelności
⚙️ Potężne opcje wyświetlania:
- Włączanie/wyłączanie poszczególnych sesji
- Pokazywanie/ukrywanie etykiet informacyjnych sesji
- Regulowana wielkość czcionki (6-20)
- Rozciąganie stref do krawędzi wykresu lub utrzymanie ich w obrębie
- Kontrola liczby dni historii do wyświetlenia (1-30 dni)
- Automatyczne czyszczenie zapobiega zagraceniu wykresu
🎯 Profesjonalny design:
- Czysta, nieinwazyjna wizualizacja
- Dynamiczne śledzenie maksimum/minimum podczas aktywnych sesji
- Prawidłowe obsługiwanie sesji nocnych
- Działa na wszystkich interwałach czasowych
- Brak opóźnień, zoptymalizowana wydajność
Idealne dla:
- Traderów stosujących metodologię ICT, poszukujących precyzyjnego timingu
- Traderów smart money śledzących przepływy instytucjonalne
- Day traderów i skalperów potrzebujących dokładnych granic sesji
- Traderów swingowych identyfikujących kluczowe strefy odwrócenia
- Każdego, kto chce dopasować transakcje do głównych sesji rynkowych
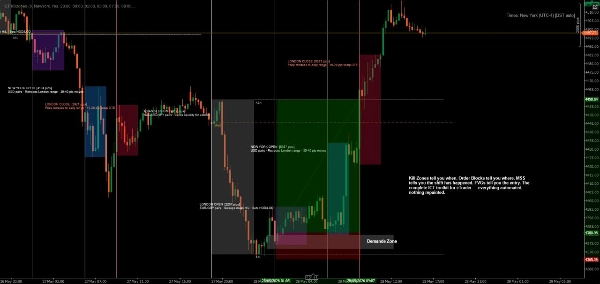
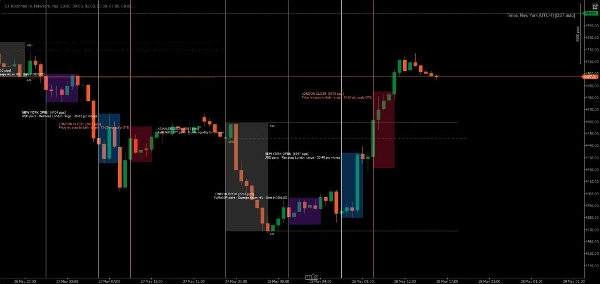
Jak to działa:
Wskaźnik automatycznie wykrywa każdy dzień handlowy i tworzy kolorowe strefy dla wszystkich pięciu sesji ICT. W miarę jak cena porusza się przez każdą sesję, wskaźnik śledzi maksimum i minimum, a następnie rysuje ostateczną strefę po zamknięciu sesji. Etykiety jasno identyfikują każdą sesję i opcjonalnie wyświetlają jej cechy handlowe.
Wszystkie czasy są podane w czasie nowojorskim (wschodnim), zgodnie ze standardową metodologią ICT.
Przykłady personalizacji:
- Konserwatywna konfiguracja: Niska przezroczystość (20-30%), subtelne kolory, brak informacji o sesji
- Odważna konfiguracja: Wysoka przezroczystość (70-80%), żywe kolory, pełne opisy sesji
- Minimalna konfiguracja: Wyłącz niechciane sesje, zachowaj tylko preferowane killzones
- Strategia kodowana kolorami: Dopasuj kolory stref do swojego nastawienia handlowego (zielony = long, czerwony = short)
Wymagania systemowe:
- Platforma: cTrader Desktop (produkty z cTrader Store nie są obsługiwane w wersjach Web lub Mobile) blog.ctrader.com
- System operacyjny: Windows 7 lub nowszy
- Procesor: Zalecany procesor dwurdzeniowy
- Pamięć: Minimum 2 GB RAM (zalecane 4 GB)
- Połączenie internetowe: 50 kB na sekundę lub szybciej
Instrukcje instalacji:
- Zakup/Instalacja: Pobierz wskaźnik ze sklepu cTrader Store
- Pobierz cTrader Desktop: Jeśli nie jest jeszcze zainstalowany, pobierz ze strony ctrader.com
- Zaloguj się: Otwórz cTrader Desktop i zaloguj się za pomocą swojego ID cTrader
- Dostęp do wskaźnika: Przejdź do sekcji "Algo" → lista "Indicators"
- Dodaj do wykresu: Kliknij prawym przyciskiem myszy na dowolny wykres → "Indicators" → wybierz "ICT Killzones Complete"
- Dostosuj: Kliknij prawym przyciskiem myszy nazwę wskaźnika na wykresie → "Settings", aby dostosować kolory, czasy i opcje wyświetlania
Wskazówki dla najlepszych wyników:
- Używaj na interwałach od 1 minuty do 1 godziny dla optymalnej widoczności
- Łącz z analizą price action i koncepcjami płynności dla najlepszych rezultatów
- Dostosuj czasy sesji, jeśli Twój broker używa innych stref czasowych
- Eksperymentuj z przezroczystością, aby znaleźć idealną równowagę wizualną
- Włączaj etykiety informacyjne sesji podczas nauki, wyłączaj dla czytelniejszych wykresów
Handluj precyzyjnie. Handluj z pewnością. Handluj metodą ICT.
Uwaga: Ten wskaźnik służy celom edukacyjnym i informacyjnym. Wyniki historyczne nie gwarantują przyszłych rezultatów. Zawsze stosuj odpowiednie zarządzanie ryzykiem.
Podsumowanie
The indicator tracks high and low prices during active sessions and finalizes zones upon session close, providing clear visual boundaries for institutional trading timing. It supports all timeframes, handles overnight sessions properly, and includes automatic cleanup of old zones to maintain chart clarity. Customization options include font size adjustment, zone extension control, and history length for displayed zones. ICT Killzones Complete is suitable for traders using ICT methodology, smart money concepts, scalping, day trading, and swing trading across markets such as Forex, commodities, and crypto. It requires cTrader Desktop on Windows 7 or higher with recommended hardware specifications.
Opinie klientów
5 | 50 % | |
4 | 25 % | |
3 | 0 % | |
2 | 25 % | |
1 | 0 % |


![Logo „High-Low Divergence [Iridio Capital]”](https://cdn.ctrader.com/image/webp/443c4661-7abb-40f1-842f-4b6ec560649b_40914)


