Opis
To nie jest typowy wskaźnik Volume Delta. To wskaźnik Level 2 DOM Volume Delta — instytucjonalnej klasy przepływu zleceń dla cTrader. Przewaga, za którą instytucje płacą miliony.
Problem, z którym mierzy się każdy detaliczny trader. Świeca zamyka się na zielono. Wolumen jest wysoki. Kupujesz.
Cena odwraca się natychmiast. Zostajesz wyeliminowany. Wykres cię „oszukał”.
Nie oszukał — po prostu nie widziałeś, co działo się wewnątrz świecy. Ten zielony słupek z wysokim wolumenem? 70% tego wolumenu to była agresywna sprzedaż. Zamknięcie było podtrzymywane przez cienką warstwę zleceń kupna na dole zakresu. Instytucje rozprowadzały swoje pozycje na twoim zleceniu kupna.
Standardowe wskaźniki wolumenu pokazują ci sumę. Nigdy nie pokazują kto miał kontrolę.
Volume Delta zmienia to. Co Volume Delta faktycznie pokazuje
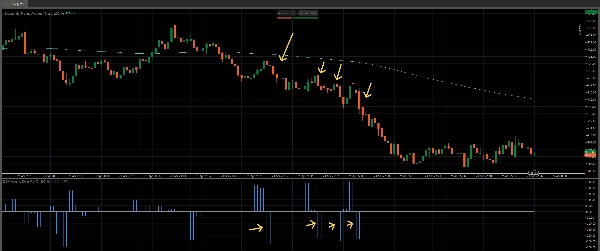
Volume Delta rozdziela wolumen każdej świecy na wolumen kupna i wolumen sprzedaży, a następnie oblicza różnicę — deltę. Dodatnia delta oznacza, że kupujący byli bardziej agresywni. Ujemna delta oznacza dominację sprzedających.
To najważniejsza informacja, która odróżnia profesjonalnych traderów od detalicznych: nie ile zostało wyhandlowane, ale która strona handlowała bardziej agresywnie. To jest przekonanie. Delta to odcisk palca intencji stojącej za każdą świecą cenową.
Ale to nie koniec
Ten wskaźnik nie zgaduje. W autorskim połączeniu danych odczytuje dane Level 2 Market Depth — rzeczywistą księgę zleceń stojącą za ceną, którą widzisz na ekranie.
Dane Level 2 (znane również jako DOM — Depth of Market) pokazują prawdziwe zlecenia kupna i sprzedaży ułożone na każdym poziomie cenowym. Nie ostatni handel. Nie szacunek. Rzeczywistą płynność spoczywającą od banków, funduszy hedgingowych i instytucjonalnych biur przepływającą przez dostawców płynności twojego brokera.
Efektem jest poziom dokładności na poziomie 85-95% w klasyfikacji wolumenu kupna versus sprzedaży — znacznie przewyższający możliwości jakiejkolwiek formuły przybliżającej.
Dlaczego to ma znaczenie — co instytucje widzą, a ty nie
Goldman Sachs, Citadel, Jump Trading — wszyscy handlują z danymi przepływu zleceń. Widzą presję kupna i sprzedaży w czasie rzeczywistym. Widzą absorpcję. Widzą, kiedy poziom jest broniony. Widzą, kiedy delta odchodzi od ceny.
Płacą miliony za tę infrastrukturę. Dane, serwery współlokowane, narzędzia autorskie.
Ten wskaźnik przenosi tę samą podstawową koncepcję na twój wykres cTrader. Nie wersję okrojoną. Rzeczywiste dane Level 2 DOM z puli płynności twojego brokera, przetworzone na tę samą klasyfikację kupna versus sprzedaży, jaką stosują profesjonalni traderzy przepływu zleceń.
Różnica między traderem detalicznym a instytucjonalnym to nie inteligencja. To informacja. Volume Delta niweluje tę różnicę.
Dla kogo to jest
Day traderzy, którzy chcą przejrzeć szum. Gdy świeca wygląda na byczą, ale delta jest ujemna, wiesz, że trzeba poczekać. Gdy świeca wygląda słabo, ale delta jest mocno dodatnia, wiesz, że instytucje akumulują. Delta nie kłamie — pokazuje, co się wydarzyło, a nie jak to wyglądało.
Skalperzy, którzy muszą wiedzieć, która strona ma kontrolę w tej chwili. Skok delty przy wybiciu potwierdza, że jest ono prawdziwe. Wybicie z płaską deltą mówi, że to pułapka, zanim zacznie się odwrócenie.
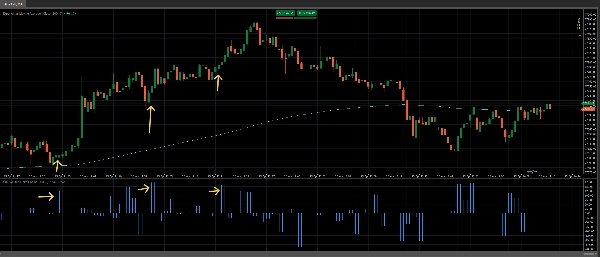
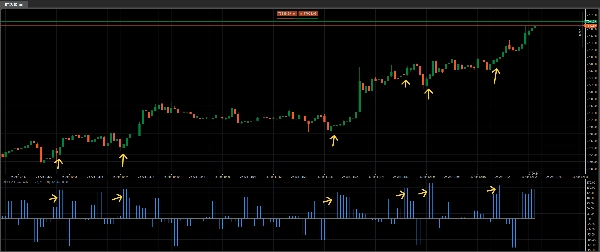
Swing traderzy, którzy chcą konfluencji. Dywergencje delty — gdy cena robi nowe minimum, a delta rośnie — są jednymi z najbardziej wiarygodnych sygnałów odwrócenia w profesjonalnym handlu. Ten wskaźnik wykrywa je automatycznie.
Każdy handlujący forexem, indeksami lub towarami na cTrader z brokerem, który udostępnia dane Level 2. Fusion Markets, IC Markets, Go Markets i podobni brokerzy ECN/STP dostarczają dane DOM, które odczytuje ten wskaźnik.
Jeśli kiedykolwiek byłeś po złej stronie świecy z „wysokim wolumenem”, to jest narzędzie, które powie ci dlaczego.
Co otrzymujesz
Czysty, profesjonalny histogram pod twoim wykresem pokazujący netto deltę dla każdej świecy, oparty na bardzo dokładnych danych. Dodatnie słupki oznaczają dominację kupujących. Ujemne słupki oznaczają dominację sprzedających. Wielkość słupka pokazuje jak bardzo jedna strona przeważała nad drugą. Używany razem z wskaźnikami takimi jak 200 ema daje konfluencję i wysokie prawdopodobieństwo udanych ustawień.
Brak bałaganu. Brak opóźnionych średnich kroczących wolumenu. Brak kolorowych świec, które „szacują” kupno i sprzedaż. Tylko surowa, nieprzefiltrowana różnica między agresywnym kupnem a agresywną sprzedażą — obliczana z najgłębszego źródła danych dostępnego dla traderów detalicznych.
Ten wskaźnik oferuje również opcję użycia filtra wolumenu, aby pokazywać tylko słupki, które mają największe znaczenie. Możliwość agregowania słupków wolumenu, jeśli chcesz.
Jedno spojrzenie na słupek delty mówi ci to, co próbują przybliżyć dziesiątki innych wskaźników. Zdobądź swój teraz dla cTrader. To oczywisty wybór przy tak niskiej cenie.
Połącz to z naszym wskaźnikiem Volume Profile Pro, aby podejmować jeszcze lepiej poinformowane decyzje na kluczowych poziomach: https://ctrader.com/products/4079
Zobacz nasz niesamowity Black Box Bot tutaj: https://ctrader.com/products/3241
Podsumowanie
The indicator displays a clean histogram below the chart representing net volume delta per bar: positive bars indicate buyer dominance, negative bars indicate seller dominance, and bar size reflects the strength of that dominance. This provides traders with insight into market intent beyond total volume, revealing whether buyers or sellers controlled the price action.
It supports forex, indices, and commodities trading with brokers offering Level 2 data, such as Fusion Markets and IC Markets. Features include volume filtering and aggregated volume bars. The tool is suited for day traders, scalpers, and swing traders seeking to interpret order flow, confirm breakouts, detect divergences, and enhance decision-making with professional-level order flow data.
Opinie klientów
5 | 50 % | |
4 | 50 % | |
3 | 0 % | |
2 | 0 % | |
1 | 0 % |