
Renko Reversal
مؤشر
14 عمليات الشراء
الإصدار 1.2، Apr 2026
Windows, Mac
4.3
التقييمات: 3
الوصف
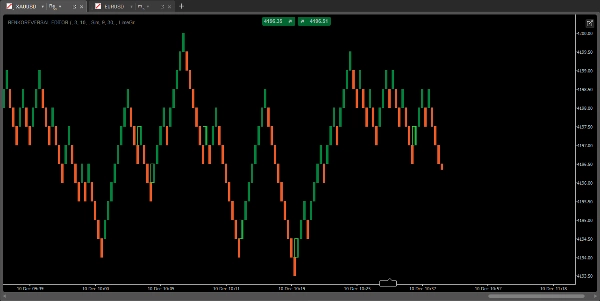
افتح نقاط دخول عالية الجودة مع مؤشر انعكاس رينكو لـ cTrader
يعد مؤشر انعكاس رينكو أداتك النهائية لالتقاط استمراريات الاتجاه بدقة على مخططات رينكو. تم تصميمه لتصفية الضوضاء والتركيز فقط على أقوى الفرص، يتجاوز هذا المؤشر مجرد تغيير لون الكتلة.
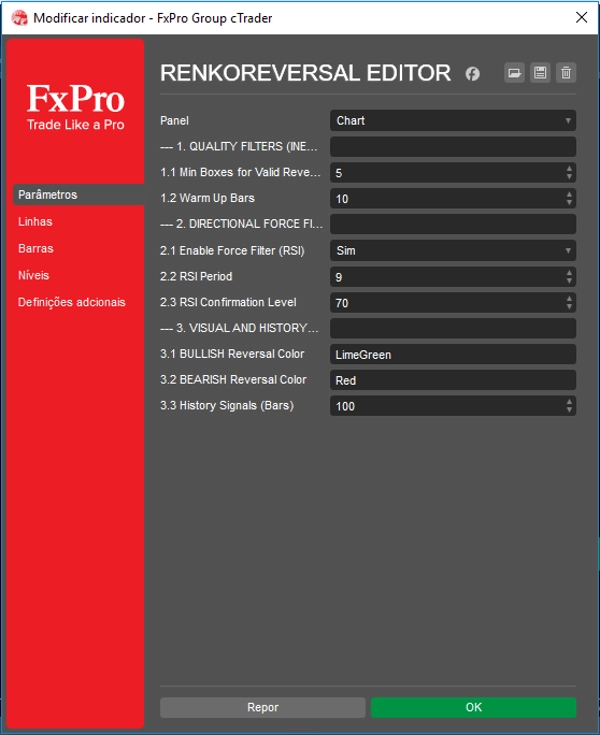
كيف يمنحك ميزة (الفلاتر الحصرية):
- فلتر القصور الذاتي: توقف عن التداول عند النقاط الضعيفة! نطلب حد أدنى من قصور الذاتي للكتلة أثناء التصحيح. يشير المؤشر فقط عندما يكون التصحيح عميقًا بما فيه الكفاية، مما يؤكد قوة الانعكاس.
- فلتر القوة الاتجاهية (RSI): يتم التحقق من الإشارة مرتين بواسطة الزخم. يتم تأكيد الاستمرارية فقط إذا أشار RSI إلى أن القوة في منطقة الاتجاه الجديد (فوق/تحت المستوى 50)، مما يضمن دخولك السوق بدقة عندما يبدأ الزخم الجديد.
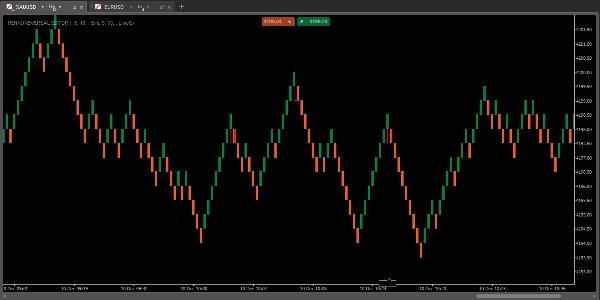
تداول بثقة:
ركز على تحولات الزخم النظيفة وادخل السوق بثقة أكبر. مع معلمات قابلة للتعديل بالكامل (القصور الذاتي، فترة RSI، والمستوى)، يمكنك تخصيص الحساسية لأي زوج أو أسلوب تداول.
قم بالتثبيت اليوم وحوّل طريقة تداولك لاستمرارية الاتجاه.
الملخص
ملخص الذكاء الاصطناعي
The Renko Reversal Indicator for cTrader is designed to identify potential trend reversal points on Renko charts by analyzing price changes and the average True Range (ATR). It visually signals possible reversals by changing the color of Renko blocks. The indicator incorporates two key filters to enhance signal quality: an Inertia Filter that requires a minimum box inertia during corrections to confirm strong reversals, and a Directional Force Filter using RSI to validate momentum shifts, signaling entries only when RSI crosses the midpoint level 50 in the new trend direction. Parameters such as Inertia, RSI period, and RSI level are fully adjustable, allowing customization for different trading styles and instruments. This indicator supports various markets including Forex, cryptocurrencies, commodities, indices, and stocks, with tags referencing symbols like BTCUSD, EURUSD, GBPUSD, XAUUSD, NAS100, and USDJPY. It is intended to assist traders in capturing trend continuations with higher precision by focusing on clean momentum shifts on Renko charts.
ملف تعريف المؤشر
تقييمات العملاء
4.3
التقييمات: 3
5 | 33 % | |
4 | 67 % | |
3 | 0 % | |
2 | 0 % | |
1 | 0 % |
تقييمات العملاء
March 2, 2025
Useful if not rushed for traders who like filtered price action. It gives value around Renko chart setups, but brick charts can hide useful detail. A fair Renko test needs 25 signals, 1R exits and a check for late reversal bricks. The chart looks cleaner, but it still needs normal price context.
March 1, 2025
March 1, 2025
Clear trading aid for Renko chart setups. it cuts down candle noise and makes direction easier to read, especially when used for filtering price movement into cleaner swings. I would check 10 to 15 bricks before trusting the direction and confirm it on normal candles. The chart looks cleaner, but it still needs normal price context.
مناقشة
الأسئلة الشائعة
BTCUSD
Forex
Signal
Breakout
Indices
EURUSD
Commodities
GBPUSD
NZDUSD
Prop
ZigZag
Scalping
Crypto
Stocks
XAUUSD
NAS100
USDJPY
يتم توفير المنتجات المتاحة من خلال cTrader Store، بما في ذلك روبوتات التداول والمؤشرات والإضافات، من قبل مطوري الطرف الثالث وإتاحتها لأغراض الوصول المعلوماتي والفني فقط. cTrader Store ليس وسيطًا ولا يقدم نصائح استثمارية أو توصيات شخصية أو أي ضمان للأداء المستقبلي.


![شعار "[Hamster-Coder] Pivot Points MTF"](https://cdn.ctrader.com/image/webp/4c143e5a-309c-40e3-a578-f04d1e133ffa_31159)


السعر
منذ 05/02/2025
31
المبيعات