
الوصف
مؤشر القوة النسبية المخصص – انعكاسات فورية بدقة ومرئيات نظيفة
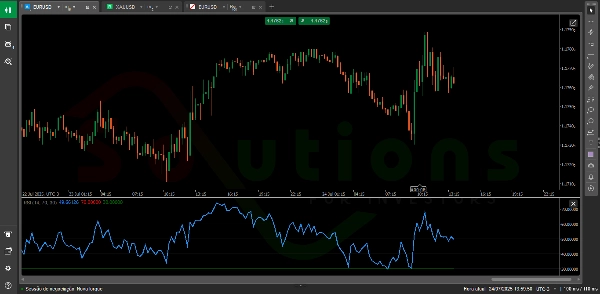
مؤشر القوة النسبية المخصص هو نسخة محسنة من مؤشر القوة النسبية (RSI) الكلاسيكي، مصمم لمساعدة المتداولين على تحديد مناطق الشراء المفرط والبيع المفرط— وهي المناطق الرئيسية التي من المحتمل أن ينعكس فيها السعر.
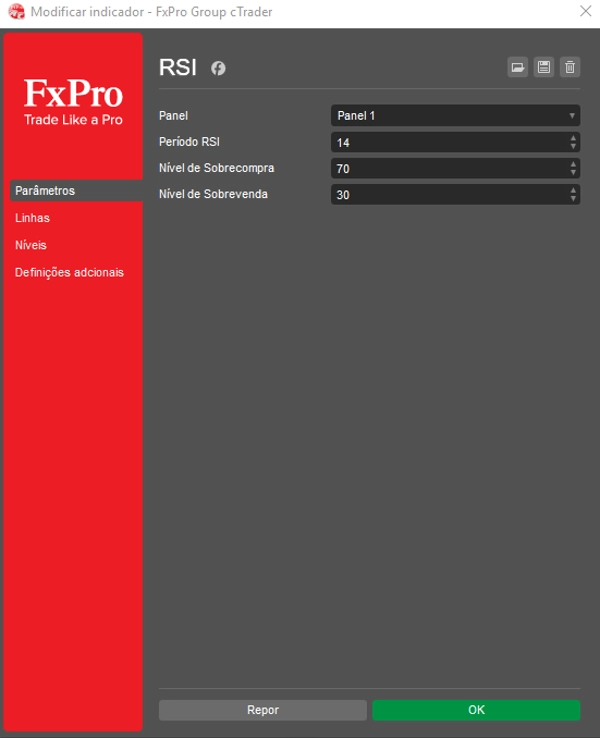
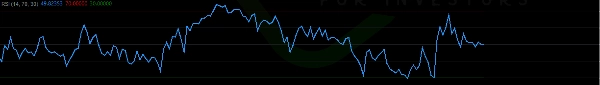
مع واجهة نظيفة وبديهية، يعرض خطين أفقيين قابلين للتخصيص بالكامل (مثل المستويات التقليدية 70 و30)، مما يحدد بوضوح نقاط اتخاذ القرار ذات الاحتمالية العالية على الرسم البياني.
✅ قم بضبط الإطار الزمني ومستويات RSI لتناسب أسلوب تداولك
✅ حدد مناطق الانعكاس المحتملة بثقة أكبر
✅ عزز تحليلك الفني بمؤشر واضح وخالي من الفوضى
مثالي للمتداولين من جميع المستويات، مؤشر القوة النسبية المخصص يحول بيانات السعر الخام إلى رؤى ذكية وقابلة للتنفيذ— مما يجعله أداة أساسية لاتخاذ قرارات مربحة.
الملخص
تقييمات العملاء
5 | 0 % | |
4 | 100 % | |
3 | 0 % | |
2 | 0 % | |
1 | 0 % |


