
الوصف
VWAP (متوسط السعر المرجح بالحجم) هو معيار تداول يحسب متوسط السعر لأصل ما مع تعديل حسب حجم التداول خلال فترة محددة. يُستخدم على نطاق واسع من قبل المتداولين اليوميين والمؤسسات وأنظمة التداول الخوارزمية لتقييم القيمة العادلة وتحسين تنفيذ الصفقات.
الصيغة الرئيسية:
VWAP=∑(Price×Volume)/∑Volume
- السعر = السعر النموذجي (الأعلى + الأدنى + الإغلاق) / 3 أو فقط سعر الإغلاق.
- الحجم = حجم التداول لكل فترة.
2. لماذا نستخدم VWAP؟
الغرض:
1)مرجع القيمة العادلة
السعر > VWAP = ميل صعودي؛ السعر < VWAP = ميل هبوطي.
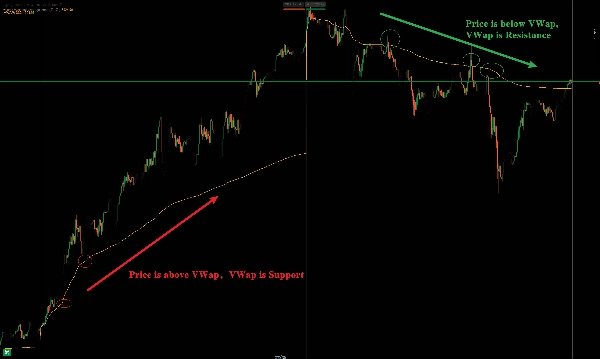
2)الدعم/المقاومة الديناميكية
يعمل كمستوى رئيسي لاختراقات/انعكاسات داخل اليوم.
3) تأكيد الاتجاه
السعر فوق VWAP = اتجاه صاعد؛ تحته = اتجاه هابط.
شرح مفصل واستخدام مؤشر متوسط السعر المرجح بالحجم (VWAP)
1. المفهوم الأساسي
VWAP (متوسط السعر المرجح بالحجم) هو أداة تحليل فني تُستخدم لقياس متوسط سعر التداول لأصل خلال فترة زمنية محددة، ويتم حسابه مع وزن حسب حجم التداول. يساعد المتداولين على تحديد "القيمة العادلة" للسعر الحالي مقارنة بالسوق، ويُستخدم عادة في التداول اليومي، التداول الخوارزمي، وتنفيذ أوامر المؤسسات.
الصيغة الأساسية:
VWAP=∑(Price×Volume)/∑Volume
يتم جمع حاصل ضرب سعر كل شمعة × حجم التداول، ثم يقسم على إجمالي حجم التداول للحصول على متوسط السعر المرجح الديناميكي.
2. الاستخدامات الرئيسية لـ VWAP
الاستخدام:
1)تحديد السعر العادل للسوق
السعر أعلى من VWAP = قوة؛ أقل من VWAP = ضعف.
2)مرجع الدعم/المقاومة
يُستخدم VWAP غالبًا كمستوى دعم/مقاومة ديناميكي للتداول قصير الأجل.
3)تأكيد الاتجاه داخل اليوم
السعر مستمر فوق VWAP = سيطرة المشترين؛ تحته = سيطرة البائعين.
الملخص
VWAP serves several key functions: it acts as a reference for fair value, where prices above VWAP indicate bullish bias and below indicate bearish bias; it provides dynamic support and resistance levels useful for intraday breakouts and reversals; and it helps confirm intraday trends, with prices sustained above VWAP signaling an uptrend and below signaling a downtrend.
This indicator supports various markets including forex, stocks, indices, commodities, and cryptocurrencies, making it a versatile tool for intraday market analysis and trading strategy development.


