
MA Sabres
مؤشر
2 عمليات الشراء
الإصدار 1.0، Aug 2025
Windows, Mac
4.5
التقييمات: 2
الوصف
سيطر على الأسواق مع هذا المؤشر المثير الذي يكتشف انعكاسات الاتجاه باستخدام متوسط متحرك ديناميكي، مطلقًا تشكيلات 'سابري' الجريئة كدعم أو مقاومة أو مناطق اختراق. مع إعدادات قابلة للتخصيص وتنبيهات حادة كالموسى، إنه سلاحك السري لتحقيق انتصارات التداول!
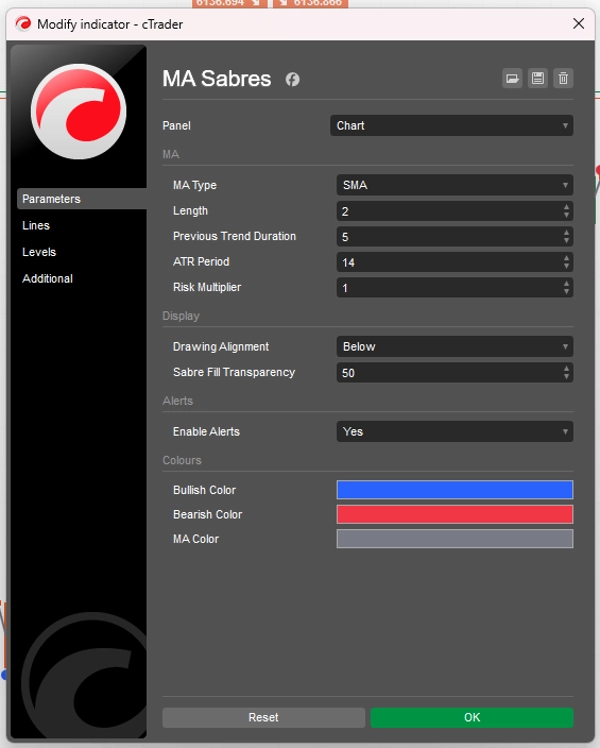
الإعدادات
- نوع المتوسط المتحرك: اختر المتوسط المتحرك من القائمة المنسدلة (SMA, EMA, SMMA_RMA, HullMA, WMA, VWMA, DEMA, TEMA, NONE لتعطيله). الافتراضي هو TEMA لإشارات سريعة.
-
- الطول: اضبط طول المتوسط المتحرك والسابري (الافتراضي: 50، الحد الأدنى: 1) للتحكم في نطاقهما.
- مدة الاتجاه السابق: حدد عدد الأعمدة (الافتراضي: 20، الحد الأدنى: 1) التي يجب أن يتجه فيها المتوسط المتحرك قبل أن يؤدي الانعكاس إلى تفعيل السابري.
- فترة ATR: اضبط فترة متوسط المدى الحقيقي (الافتراضي: 14، الحد الأدنى: 1) لتشكيل مواضع السابري بناءً على تقلبات السوق.
- مضاعف المخاطرة: زد أو قلل مسافة السابري من السعر (الافتراضي: 1.0، النطاق: 0.1–5.0) لإشارات أكثر جرأة أو إحكامًا.
- محاذاة الرسم: ضع السابري والدوائر فوق، تحت، أو في الوسط (الافتراضي: في الوسط) لتجنب ازدحام الرسم البياني.
- شفافية تعبئة السابري: عدل شفافية التعبئة (الافتراضي: 50، النطاق: 0–100) لرؤية واضحة.
- تفعيل التنبيهات: قم بتشغيل المفتاح (الافتراضي: false) لتلقي تنبيهات صوتية.
كيفية الاستخدام
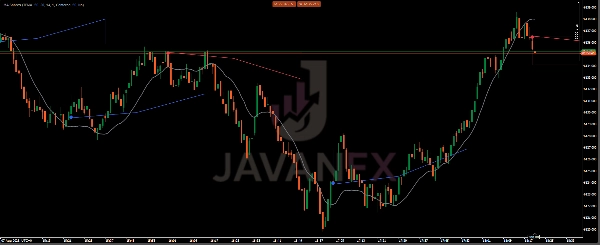
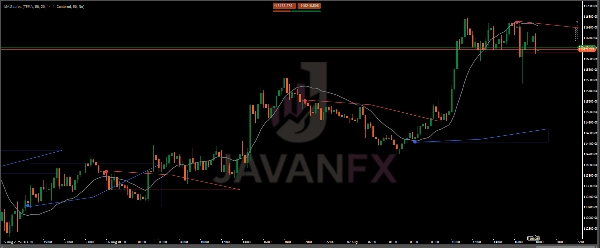
- اكتشف الانعكاسات:
-
- ابحث عن السابري (أربع خطوط اتجاه مع قاعدة مملوءة) والدوائر (ثلاثة أيقونات متراكبة) عندما يتحول المتوسط المتحرك بعد اتجاه ثابت.
- سابري صاعد مع دوائر زرقاء يشير إلى ارتفاع صعودي؛ سابري هابط مع دوائر حمراء يشير إلى هبوط هبوطي.
- اضبط إعداداتك:
-
- قصّر الطول (مثلاً، 20) ومدة الاتجاه السابق (مثلاً، 10) للحركات السريعة في الأسواق المتقلبة.
- زد مضاعف المخاطرة (مثلاً، 2.0) لسابري أوسع في الاتجاهات أو قلله (مثلاً، 0.5) للدقة في النطاقات.
- غيّر المحاذاة إلى فوق أو تحت إذا كانت الشموع تحجب الرؤية.
- استخدم التنبيهات:
-
- شغّل تفعيل التنبيهات للحصول على إشعارات فورية على الرسم البياني.
- تكتيكات التداول:
-
- الدخول: ادخل صفقة شراء على سابري/دائرة صاعدة أو صفقة بيع على سابري هابطة.
- الخروج: تتبع خط اتجاه المتوسط المتحرك كوقف خسارة أو اخرج عند إشارة سابري معاكسة.
- التحقق: اجمع مع أدوات مثل UT Bot Alert، RSI أو Bollinger Bands لإعدادات قوية.
الملخص
ملف تعريف المؤشر
تقييمات العملاء
4.5
التقييمات: 2
5 | 50 % | |
4 | 50 % | |
3 | 0 % | |
2 | 0 % | |
1 | 0 % |
تقييمات العملاء
October 10, 2025
Smooth and clean ⚡ MA Sabres cuts through noise like blades — great trend clarity, fast updates, and zero lag. Perfect base for MA-based systems!
August 14, 2025
Demo first, then maybe small size if the notes look sane. Account protection still comes first.
مناقشة
الأسئلة الشائعة
يتم توفير المنتجات المتاحة من خلال cTrader Store، بما في ذلك روبوتات التداول والمؤشرات والإضافات، من قبل مطوري الطرف الثالث وإتاحتها لأغراض الوصول المعلوماتي والفني فقط. cTrader Store ليس وسيطًا ولا يقدم نصائح استثمارية أو توصيات شخصية أو أي ضمان للأداء المستقبلي.


السعر
منذ 14/07/2025
60
المبيعات