present
Inscrivez-vous et bénéficiez d'une remise de 50 $ sur votre premier achat
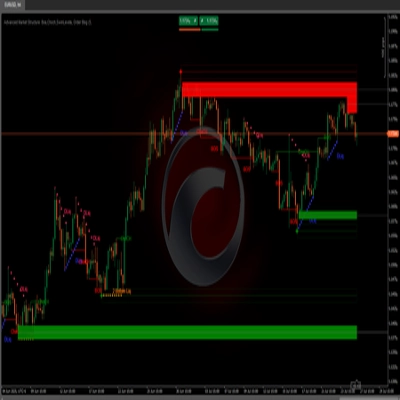
Trading product for Supertrend Indicateur BTCUSD Breakout, image 1
Supertrend
4.3
Avis : 3
Depuis le 03/10/2024
178
Ventes
45.5K
Installations gratuites

Description

Indicateurs Pinescriptlabs Store:                        Pinescriptlabs  Store cBots :  (cBot) Gold & BTC BreakoutSession Pivots(nouveau)

PRICE ACTION  (Nouveau)

Trailing Smart Algorithm (nouveau)

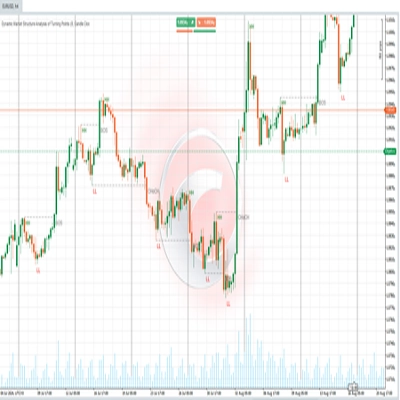
S&R Structural ZigZag                                

ZigZag

 BOS & CHOCH

Zones Supply Demand

Leverage Liquidation Map

Auto-Trend Channel


Volume POC Heatmap


PREMIUM SSL CHANNEL

Prediction Based on Linreg & ATR

 ICT Power of 3 
                                                   

SmartTrend Support &
Resistance
Lines
       

Fair Value Gap Sessions                


RSI Trend Trigger

Channel Breakout System

Supertrend

Market Imbalance

Adaptive Trend Channel 

Analyse
Dynamique
de la Structure
du Marché
des
Points de retournement

Order Block

Fibonacci
Régression
Linéraire
Multi-échelle

RSI Dynamique

Momentum Fair Value Gap

Projection du Flux du Marché

Gradient de Tendance Dynamique

Multi-niveaux
Biais des Chandeliers
Tracker

Suivi des Extrémités Zig-Zag

Moyenne Mobile Réactive

Support
et Résistance
Automatiques
Tendance
Lignes

Tous
les Supports et
Résistances
Niveaux

Momentum de la Plage Dynamique

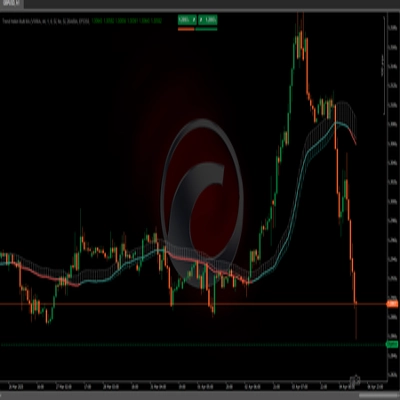
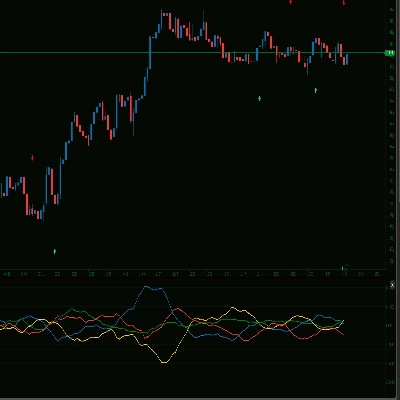
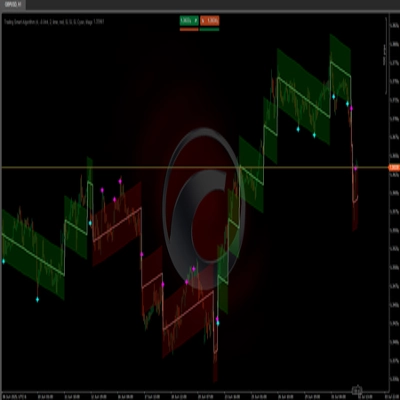
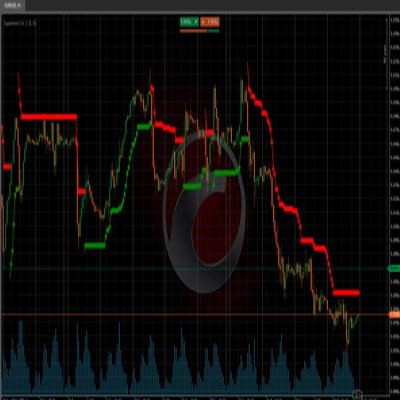
🚀 **Algorithme de suivi de tendance** qui utilise la **Moyenne de la Vraie Plage (ATR)** 📊 pour définir un canal de prix 📈 et déterminer la direction de la tendance (haussière 🟢 ou baissière 🔴). L'indicateur change de couleur et trace des lignes selon la tendance, facilitant la visualisation des changements de momentum du marché. 💹


### 🔧 **Entrées** :


1. **Périodes ATR** ⏳ :

- Définit le nombre de périodes pour calculer la **Moyenne de la Vraie Plage**. Cela affecte la sensibilité de l'indicateur, vous aidant à capter les mouvements du marché plus rapidement ou plus lentement.


2. **Multiplicateur ATR** 🔍 :

- Ajuste la distance entre les lignes de tendance 📉 en fonction de la volatilité du marché 🌊. Une valeur plus élevée élargit le canal, réduisant les faux signaux tout en offrant une vue plus claire des mouvements majeurs du marché. 📐


Résumé

Résumé IA
The Supertrend indicator is a trend-following tool that uses the Average True Range (ATR) to define a dynamic price channel and identify market trend direction as bullish or bearish. It visually represents trend shifts by changing colors and drawing lines on the price chart, facilitating the recognition of momentum changes. Key adjustable inputs include the ATR Periods, which set the number of periods for ATR calculation affecting sensitivity, and the ATR Multiplier, which adjusts the channel width based on market volatility to balance signal accuracy and noise reduction. This indicator supports analysis across various markets including cryptocurrencies (e.g., BTCUSD), commodities (e.g., gold, XAUUSD), and others. It is designed to help traders visualize and follow prevailing trends by providing clear, adaptive trend signals derived from price action and volatility measures.
Profil de l'indicateur

Discussion

Avis clients

4.3
Avis : 3
5
33 %
4
67 %
3
0 %
2
0 %
1
0 %
Avis clients
October 6, 2024
Useful in the right hands if the trader wants it helps keep attention on the broader move. It works best as support, not a final decision maker. I would judge the trend read across 3 sessions, with at least 2 higher timeframe candles agreeing. sideways markets can weaken the signal.
October 5, 2024
October 5, 2024
Solid option for review for traders who prefer directional setups. It gives value around trend filtering, but sideways markets can weaken the signal. The signal feels safer when trend strength is clear and DD stays under 3 percent. It is a filter for bias, not a reason to ignore risk.

Questions fréquentes

BTCUSD
Breakout
Supertrend
Commodities
RSI
Crypto
XAUUSD
ATR
Les produits disponibles sur cTrader Store, notamment les bots de trading, les indicateurs et les plug-ins, sont fournis par des développeurs tiers et mis à disposition à titre informatif et à des fins d'accès technique uniquement. cTrader Store n'est pas un courtier et ne fournit aucun conseil en investissement, aucune recommandation personnelle ni aucune garantie quant aux performances futures.

Plus de cet auteur

Logo de "ZigZag"
4.3
(6)
Gratuit
ZigZag filters noise, spots trends, patterns, pivots, aiding analysis, trade management, and confirmations. 📉📈
Identify bullish and bearish Order Blocks to spot key support/resistance levels and potential trend reversals! 📈🔄
📊 Shows volume by price levels, highlights POC, and key zones. Identifies dynamic support/resistance and imbalances.
Market structural patterns , specifically the concepts of Change of Character (ChoCH) 🔄 and Break of Structure (BoS) 💥
Adaptive trend channel using linear regression and Pearson correlation for dynamic support, resistance, and trends.
"Identify key market zones and visualize support/resistance from multiple timeframes on a single chart.
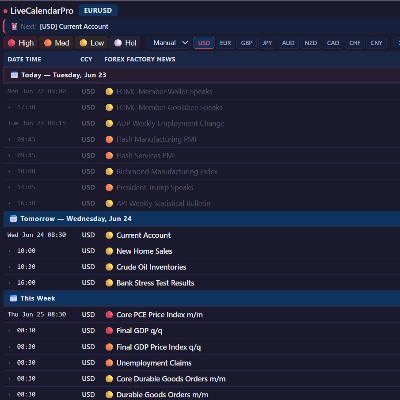
Displays live economic events directly inside your cTrader charts.
Identify market structure effortlessly with swing highs, lows, CHoCH, and BOS levels for smart trading decisions! 📊🔍"
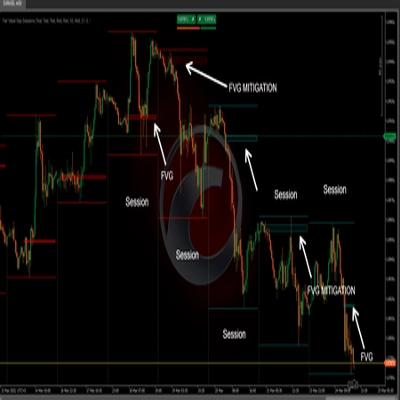
identify and highlight temporary market inefficiencies known as "fair value gaps" 🚨 within specific trading Sessions.
Advanced price action tool that combines multiple technical analysis concepts
📊Zones Supply & Demand: Identifies key price levels with high volume concentration, marking Supply/Demand Zones & Marke
🚀 TrendHeikinMultiMA: Advanced trend detection using Heikin-Ashi smoothing & MAs! Eliminates noise, confirms real trend

Vous pourriez aussi aimer

Opening ranges, dynamic trend channels, and multi-scale breakout/retest analysis for clear intraday chart decisions.
Configure, simulate, and analyze trading strategies with custom filters, multi-target exits, and detailed performance me
Strong Supertrend Turn Market Movement into a Clear Map Market analysis
Auto-centers price when it moves beyond threshold. Adjustable zoom. Works on any chart type. Never lose price again.
Save time by lighting a candle to look within yourself in another temporality
Signal Quality Score - 0-100 filter combining RSI, Volume, ATR, Trend Strength & Alignment. Works on ANY chart type.
Multi EMA Timeframes lets you stay on your chart and see the exact EMA from any timeframe you choose — up to 5 at once.
GOLD SENTINEL v1.0 - A CANDLE-COLORING INDICATOR FOR GOLD.
NTNPICLL is a tool to check the best trading hours for the assets and also includes the highest and lowest point
Logo de "ZigZagSmartAlert"
4.2
(4)
$19
/
$30
ZigZag Smart Alert for cTrader Description: ZigZag Smart Alert is a next-generation swing indicator for cTrader, designe
Forex Strength Meter for cTrader: 4 custom currencies, cross alerts, visual arrows. Trade smarter!
Unlock market insights with our Multi-Timeframe Market Levels indicator, enhancing your trading strategies effortlessly
Trailing algo 📈 auto-tracks trends 🎯 adapts to volatility 🌟 precise moves 🛡️ retest signals 🚀 no lag, smart market
Version 3: Full control of session display including start and end times of all 3 sessions!
MACD Advanced -- It combines the standard MACD logic with a rich set of visual tools
Volume profile indicator that auto-detects the latest trendline. Shows POC, Value Area (VAH/VAL), and High Volume Nodes
Session Volume Profile + Composite. POC/VAH/VAL, Focus/Solo. Fast, clean, no ghosts, live-ready.
Custom ADX Indicator for precise trend analysis. المؤشر المخصص ADX لتحليل الاتجاه بدقة

Prix

Depuis le 03/10/2024
178
Ventes
45.5K
Installations gratuites