
الوصف
خريطة الارتباط – أداتك الأساسية لفهم السوق
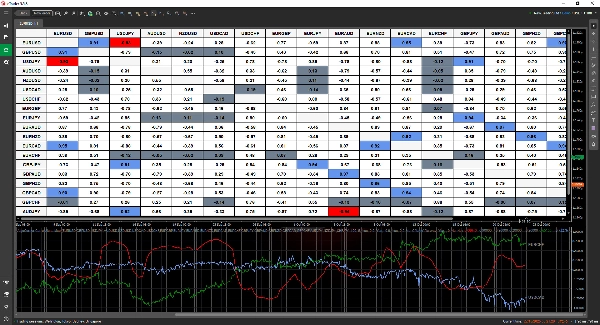
تُعد خريطة الارتباط مؤشراً قوياً وبديهيًا مصممًا لمساعدتك على اكتشاف العلاقات بين الأصول بنظرة سريعة. بفضل تنسيق الجدول السهل القراءة، يمكنك بسرعة تحديد الارتباطات واتخاذ قرارات تداول أكثر وعيًا.
✅ خصص تحليلك – اختر وقارن بين أزواج التداول بقدر ما يسمح به منصتك.
✅ أطر زمنية مرنة – حلل الارتباطات عبر أي إطار زمني ليتناسب مع استراتيجيتك.
✅ عرض واضح وقابل للتكيف – اختر بين التنسيق العشري (-1 إلى 1) أو النسبة المئوية (-100% إلى 100%).
✅ تمييز ذكي – حدد بسهولة الارتباطات القوية والضعيفة مع ترميز لوني قابل للتخصيص.
✅ تنبيهات في الوقت الحقيقي – كن متقدمًا مع الإشعارات عند تغير قيم الارتباط بشكل كبير.
✅ بيانات تفاعلية – انقر على أي خلية لتتبع كيفية تطور الارتباطات مع مرور الوقت.
✅ تحسينات مستمرة – استمتع بالتحديثات المستقبلية دون أي تكلفة إضافية.
اكتشف العلاقات الرئيسية في السوق وحسّن استراتيجيتك التداولية مع خريطة الارتباط! 🚀
الملخص
Key features include customizable display options with correlation values shown in decimal (-1 to 1) or percentage (-100% to 100%) formats, and smart color-coded highlighting to quickly identify strong or weak correlations. Users can interact with the data by clicking on any cell to track how correlations evolve over time. Real-time alerts notify users of significant changes in correlation values, aiding timely decision-making.
This tool is intended to help traders uncover relationships between assets efficiently, supporting more informed market analysis and strategy refinement.
تقييمات العملاء
5 | 67 % | |
4 | 33 % | |
3 | 0 % | |
2 | 0 % | |
1 | 0 % |


![شعار "[Stellar Strategies] Inside Bar with Signals"](https://cdn.ctrader.com/image/webp/1d9e8bfa-3b2c-4440-bb37-5856902008a7_30683)


