
AlgoCorner Crosshair Edge
مؤشر
الإصدار 1.0، Apr 2025
Windows, Mac
5.0
التقييمات: 1
الوصف
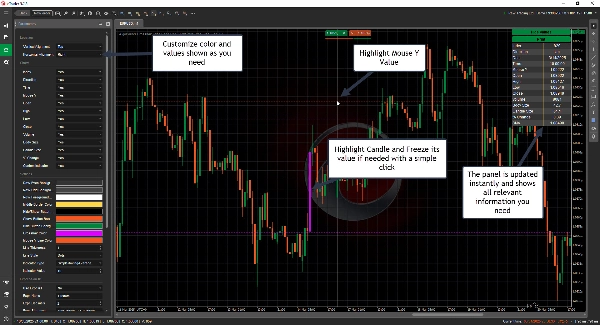
كروسهير إيدج: أفضل أداة لتصور بيانات cTrader
مع كروسهير إيدج، أداة قوية تحسن تصور بيانات السوق داخل منصة cTrader، يمكنك رفع تحليل المخططات الخاصة بك إلى آفاق جديدة.
تفاعل محسّن مع المخطط
- تمييز الشمعة الحالية ونطاقها
- تجميد مؤشر التقاطع على شمعة معينة بنقرة، وإلغاء التجميد بنقرة أخرى عند الحاجة
- إرسال القيم إلى سجلّك ليتم نسخها بسهولة
- إظهار أو إخفاء التخطيط حسب الحاجة
تخصيص كامل
- تخصيص الألوان حسب أسلوبك
- ضبط مؤشر التقاطع في أي موقع تحتاجه داخل المخطط
- اختيار القيم المعروضة والقيم التي يجب حذفها
عرض بيانات الشمعة الفوري
ما عليك سوى التمرير فوق أي شمعة للتحقق من جميع تفاصيلها وأكثر
- المؤشر
- الاتجاه
- التاريخ
- الوقت
- سعر الماوس Y
- الافتتاح
- الأعلى
- الأدنى
- الإغلاق
- الحجم
- حجم الجسم
- حجم الشمعة
- ٪ التغير
- قيم مؤشرات متعددة
-
- ADX
- ATR
- تدفق الأموال تشايكين
- EMA، HMA، SMA، TSMA، TMA، WMA
- حجم الرصيد
- RSI
- STD
- الإغلاق المرجح
- تنعيم ويلز وايلدر
- ويليامز %R
- رسم خطوط أفقية/عمودية باستخدام مفاتيح اختصار سهلة
-
- رسم خط أفقي: Ctrl + 1
- رسم خط عمودي: Ctrl + 2
- مفاتيح الاختصار قابلة للتخصيص بالكامل
- صيغ قابلة للتخصيص
-
- استخدم الافتتاح، الأعلى، الأدنى، الإغلاق، والمؤشر لحساب الصيغ التي تناسب احتياجاتك
- مثال، السعر النموذجي: (High[index] + Low[index] + Close[index])/3.0
تكامل سلس
- الرخصة مرتبطة بمعرف cTrader الخاص بك لسهولة الاستخدام
- تحديثات مستقبلية مشمولة
قم بترقية تجربة التداول الخاصة بك مع كروسهير إيدج اليوم! 🚀
الملخص
ملف تعريف المؤشر
تقييمات العملاء
5.0
التقييمات: 1
5 | 100 % | |
4 | 0 % | |
3 | 0 % | |
2 | 0 % | |
1 | 0 % |
تقييمات العملاء
مناقشة
الأسئلة الشائعة
Indices
RSI
ATR
يتم توفير المنتجات المتاحة من خلال cTrader Store، بما في ذلك روبوتات التداول والمؤشرات والإضافات، من قبل مطوري الطرف الثالث وإتاحتها لأغراض الوصول المعلوماتي والفني فقط. cTrader Store ليس وسيطًا ولا يقدم نصائح استثمارية أو توصيات شخصية أو أي ضمان للأداء المستقبلي.


![شعار "[Stellar Strategies] MARSI Signal Plotter"](https://cdn.ctrader.com/image/webp/7b2b8da6-8f8e-4646-8d4a-4710c516c01e_25567)
![شعار "Gaussian Channel [Iridio Capital]"](https://cdn.ctrader.com/image/webp/7c039209-5573-4a54-a072-f9528b503103_41960)


السعر
10
المبيعات
344
التثبيتات المجانية