
説明
コポック曲線とは何ですか?
コポック曲線は、もともとS&P 500の主要な市場の底を特定するために設計された長期モメンタム指標です。1962年に経済学者エドウィン・コポックによって作成されました。彼はエピスコパル教会から基金のための低リスクの買い場を見つけるよう依頼されていました。
簡単に言うと、これはトレンドフォロー型のオシレーターで、ベアマーケットが底を打ち、新しいブルマーケットが始まる可能性が高いことを教えてくれます。
「秘密のソース」(仕組み)
多くの指標が敏感で反応的であるのに対し、コポック曲線は意図的に遅く設計されています。これは、2つの異なる変化率(ROC)の合計の加重移動平均(WMA)を取ることで計算されます。
Coppock = WMA(10) of (ROC(14) + ROC(11))
論理:
価格モメンタムが長期間(通常11ヶ月と14ヶ月)でどのくらい変化しているかを測定します。このデータを加重平均で平滑化することで、ほとんどすべての短期的な市場ノイズを除去します。
面白い事実:
コポックは、愛する人を失った悲しみから回復するのにどれくらい時間がかかるかを司教たちに尋ねたと言われています。彼らは「11〜14ヶ月」と答えました。彼はその同じ期間を市場に適用し、市場心理も悲しみと回復の類似したサイクルに従うと考えました。
なぜ役立つのか?
トレーダーや投資家がコポック曲線を好む主な理由は3つあります:
- ノイズをフィルターする: 伝統的に月次の時間枠で計算されるため、日々や週ごとのボラティリティを無視します。頻繁にシグナルが出るわけではありませんが、出たときは通常重要です。
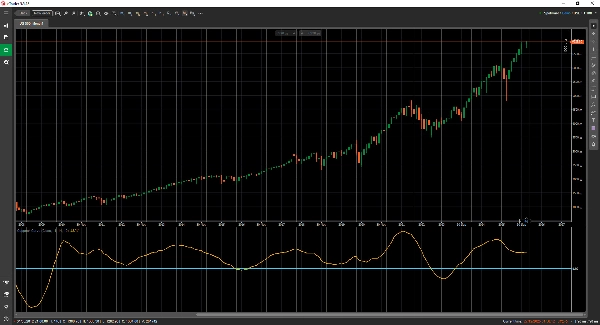
- 明確な買いシグナル: シグナルは二値的で読みやすいです。曲線がゼロラインの下にあり、上向きに転じた(上昇し始めた)ときに「買い」シグナルが生成されます。
- 心理的アンカー: 「落ちるナイフを掴む」ことを防ぎます。モメンタムが数学的にマイナスからプラスに変わるまで待つことを強制し、その後にポジションを取るようにします。
使うタイミング
- 最適な用途: 長期投資、退職資金の配分、新しいブルランの開始の特定。
- 適さない用途: デイトレードやショート。売りシグナルや市場の天井を特定するためには設計されていません。
概要
AIによる概要
The Coppock Curve is a long-term momentum indicator developed in 1962 by economist Edwin Coppock to identify major market bottoms, originally applied to the S&P 500. It functions as a trend-following oscillator designed to signal the end of bear markets and the start of new bull markets. The indicator calculates a weighted moving average (WMA) of the sum of two rates of change (ROC) over 11 and 14 months, smoothing out short-term market fluctuations. This approach filters noise and provides clear, binary buy signals when the curve rises from below zero. The Coppock Curve is primarily used for long-term investing and retirement allocation strategies, helping investors avoid premature entries during downtrends by confirming momentum shifts from negative to positive. It is not intended for day trading, shorting, or identifying market tops. The indicator is commonly applied to indices such as the S&P 500 and NASDAQ.
インジケーターのプロフィール
カスタマーレビュー
0.0
レビュー: 0
カスタマーレビュー
この商品にはまだレビューがありません。お使いになったことがある方は、ぜひレビューをお願いします。
ディスカッション
よくあるご質問
Indices
RSI
NAS100
cTrader Storeで入手可能な取引ボット、インジケーター、プラグインなどの商品は、第三者の開発者が提供するものであり、情報と技術の取得のみを目的としてご利用いただけます。cTrader Storeはブローカーではなく、投資助言や個人的な推奨を行うことも、将来のパフォーマンスを保証することもありません。
この作成者の他の商品


価格
11
販売
353
無料インストール