説明
HCCC MTF - ハーストサイクル複合チャネル(100%無料)
概要
このHCCC MTF(ハーストサイクル複合チャネル)は、高度で完全にインタラクティブなマルチタイムフレーム(MTF)ダッシュボードおよびチャネルインジケーターです。J.M. ハーストの周期理論とATRボラティリティを組み合わせており、このツールは複数のタイムフレームで同時に真の市場トレンドと完璧な周期の転換点(ピークと谷)を特定するのに役立ちます。
半自動取引専用の2つ目はこちら https://ctrader.com/products/3618?u=cLogic
重要:このインジケーターは完全に100%無料です。特に「Follow The Trend XAU Edition」cBotの究極のビジュアルコンパニオンとして開発されました。
手動取引にも完璧に使用できますが、その真の力は半自動設定で使用したときに発揮されます。HCCCダッシュボードで上位タイムフレームのサイクルとモメンタムを読み取り、その方向に正確に取引を実行・管理するためにFollow The Trend XAU Edition cBotを有効にします。
主な特徴
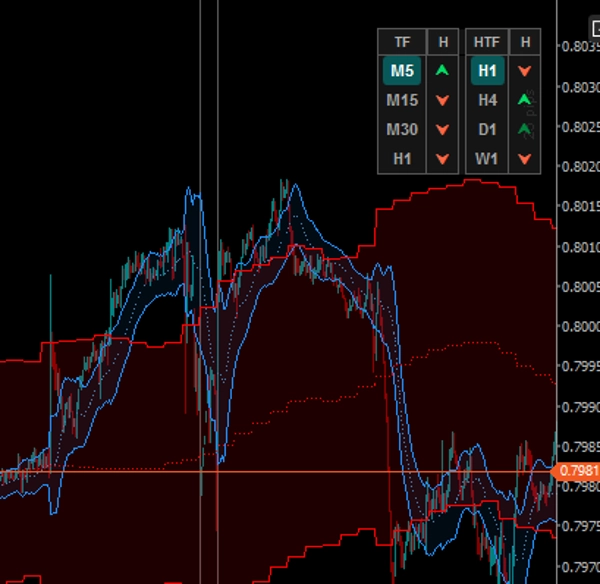
1. インタラクティブMTFダッシュボード(クリック可能)
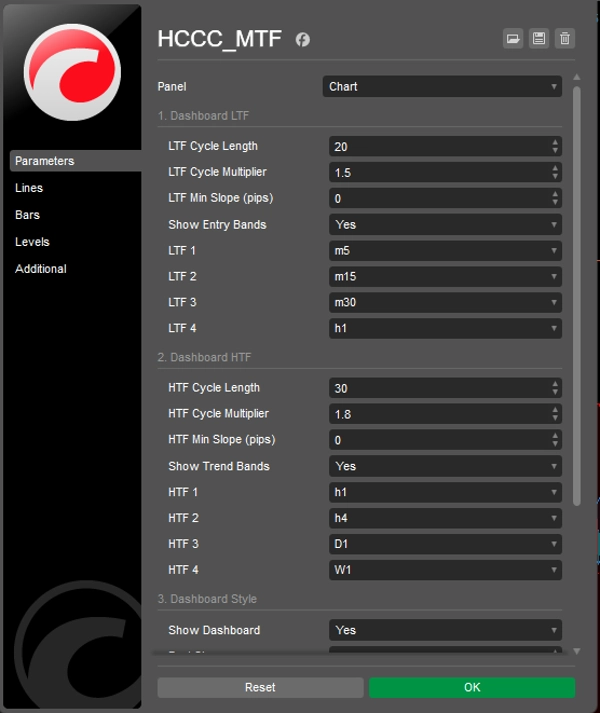
チャート間の切り替えを忘れてください。オンチャートダッシュボードは4つの低タイムフレーム(LTF)と4つの高タイムフレーム(HTF)を追跡します。
- LTFボタン: 任意のLTFボタンをクリックすると、現在のチャートのタイムフレームが即座に変更されます。
- HTFボタン: 任意のHTFボタンをクリックすると、その特定の高タイムフレームのチャネルが現在のチャートに直接投影されます!
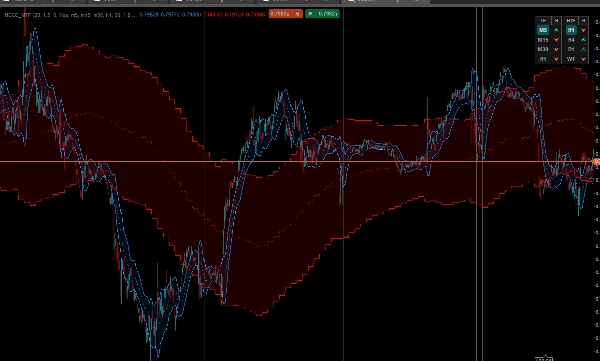
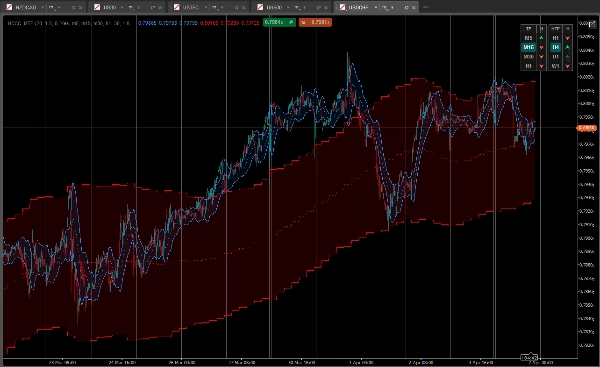
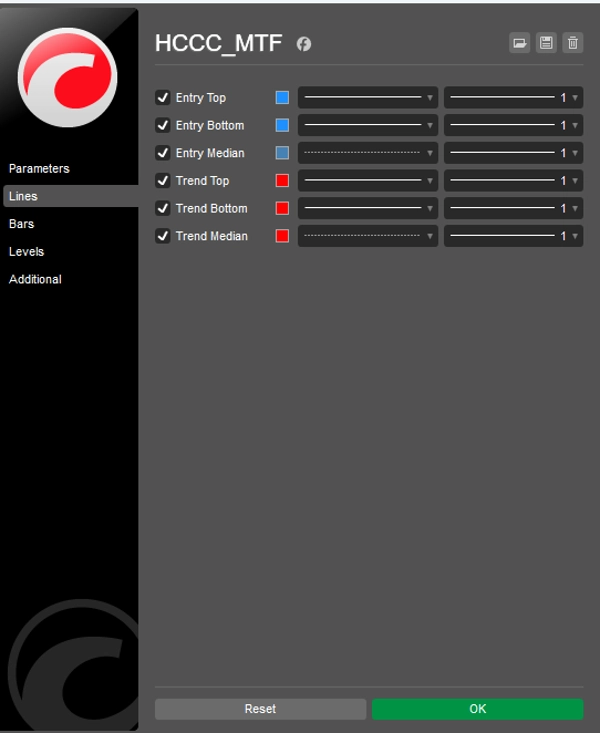
2. デュアルチャネルオーバーレイシステム
インジケーターは同時に2つのエレガントなクラウドで満たされたチャネルをチャートにプロットします:
- エントリーサイクル(青いクラウド): 現在のチャートのタイムフレームに基づいてハーストサイクルを計算します。
- トレンドサイクル(赤いクラウド): ダッシュボードで選択した高タイムフレームから計算されたマクロビューのチャネルです。
3. 高度な5状態サイクルシグナル
ダッシュボードは単にトレンドの方向を示すだけでなく、中央値線の傾きとATRバンドに対する価格の位置を分析してサイクルのフェーズを表示します。
- [ ⮝ ] ダークグリーン(強い買い): 中央線の傾きが上向きで、価格が下部バンドまで下落しています。これはサイクルの谷(押し目買い)です。
- [ ⮝ ] ライトグリーン(弱い買い): トレンドは上向きですが、価格は中央値または上部バンド付近をうろついています。
- [ — ] グレー(中立): サイクルはフラットで、明確なモメンタムはありません。
- [ ⮟ ] ライトレッド(弱い売り): トレンドは下向きですが、価格は中央値付近にあります。
- [ ⮟ ] ダークレッド(強い売り): 中央線の傾きが下向きで、価格が上部バンドまで上昇しています。これはサイクルのピーク(戻り売り)です。
「Follow The Trend XAU Edition」cBotと一緒に使うには?
- ダッシュボードの右側(HTF列)を見てください。高タイムフレームで明確な整列(例:H4とD1がダーク/ライトグリーンの矢印を表示)を待ちます。
- ダッシュボードの左側(LTF列)を見て、局所的なプルバック(例:M15がダークグリーンの「強い買い」矢印を表示)を探します。
- MTFロジックが整ったら、「BUY」方向でFollow The Trend XAU Edition cBotを起動し、そのアルゴリズムにエントリー、トレーリングストップ、リスク管理を任せます。
カスタマイズ
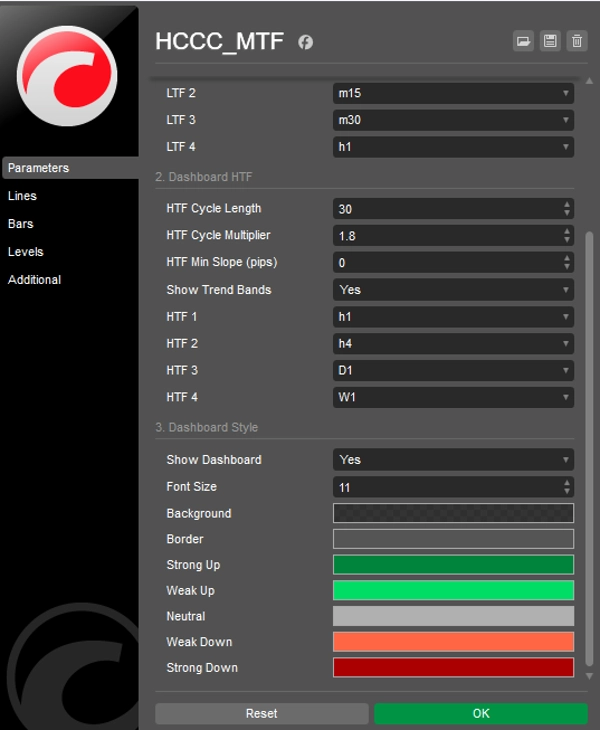
すべて完全にカスタマイズ可能です:サイクル長、ATR乗数、ノイズを除去するための最小傾き感度(ピップ単位)、UIの色や配置の完全なコントロール。
今すぐ無料でダウンロードして、半自動取引を次のレベルに引き上げましょう!
概要
It overlays two cloud-filled channels: a blue "Entry Cycle" channel based on the current timeframe and a red "Trend Cycle" channel derived from a selected higher timeframe. The dashboard provides advanced five-state cyclic signals indicating strong or weak buy/sell conditions and neutral phases by analyzing the slope of the median line and price position relative to ATR bands.
The indicator is fully customizable, including cycle lengths, ATR multipliers, slope sensitivity, and UI appearance. It is intended to complement the "Follow The Trend XAU Edition" cBot by providing visual cycle and momentum analysis to guide semi-automated trade execution and management. The HCCC MTF supports various markets including Forex, commodities, indices, stocks, and cryptocurrencies.