
Beschreibung
Überblick
Hören Sie auf, die Marktrichtung zu erraten. EMA MTF Cloud & Dashboard ist ein umfassendes Trendfolge-Toolkit, das für Scalper und Daytrader entwickelt wurde. Es kombiniert die Glätte der Exponentiellen Gleitenden Durchschnitte mit der Kraft der Multi-Timeframe-Analyse, alles in einer sauberen Chart-Oberfläche.
Im Gegensatz zu Standardindikatoren enthält dieses Tool eine Smart Neutral Zone-Logik, um unruhige Märkte herauszufiltern und Sie vor falschen Signalen während Seitwärtsphasen zu schützen.
Hauptmerkmale
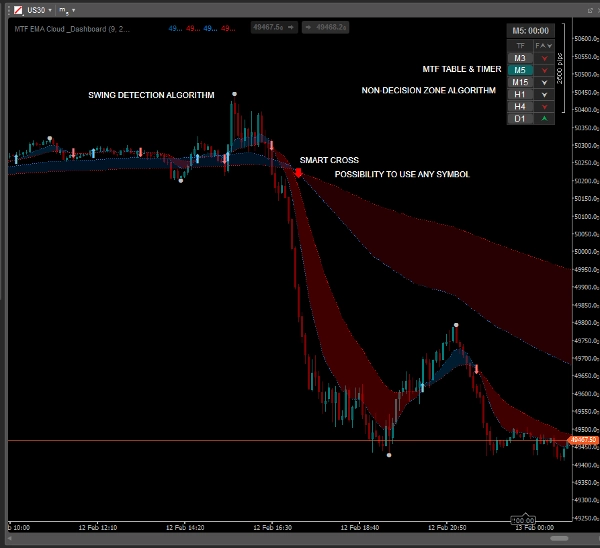
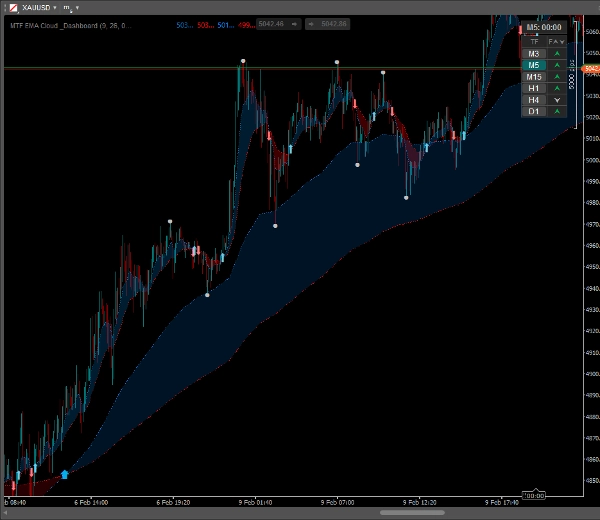
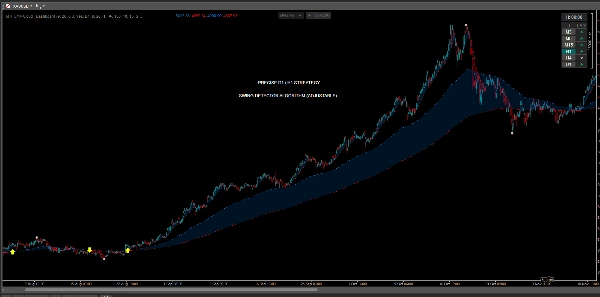
✅ Dynamische EMA-Wolken
Visualisieren Sie den Trend sofort. Der Raum zwischen schnellen und langsamen EMAs wird mit einer halbtransparenten Wolke gefüllt, was es einfach macht, die Trendstärke und potenzielle Unterstützungs-/Widerstandsbereiche zu erkennen.
✅ MTF Overlay (Multi-Timeframe)
Sehen Sie das "große Ganze", ohne die Charts zu wechseln. Zeigen Sie EMAs höherer Zeitrahmen (z. B. H1) direkt in Ihrem Chart mit niedrigerem Zeitrahmen (z. B. M5) an.
- Enthält separate Kreuzungspfeile für den MTF-Trend!
✅ Smart Trend Dashboard
Eine kompakte, anklickbare Tabelle, die den Trendstatus für 6 Zeitrahmen (M3 bis täglich) anzeigt.
- Neutral Zone Logik: Das Dashboard erkennt Seitwärtsmärkte (Konsolidierung) und markiert sie grau/silbern, um Ihnen zu helfen, schlechte Trades zu vermeiden.
- Interaktiv: Klicken Sie auf eine beliebige Zeitrahmen-Schaltfläche in der Tabelle, um sofort den Chart zu wechseln.
✅ Swing High / Swing Low Punkte
Markiert automatisch bedeutende lokale Hochs und Tiefs. Perfekt zum Platzieren von Stop Loss-Orders oder zum Identifizieren von Take Profit-Niveaus basierend auf der jüngsten Preisstruktur.
✅ Visuelle Kreuzungssignale
Klare, anpassbare Pfeile erscheinen genau dann, wenn der schnelle EMA den langsamen EMA kreuzt.
- Passen Sie Farben, Größen und Pfeilstile an.
✅ Kerzen-Timer
Ein integrierter Countdown-Timer zeigt genau an, wie viel Zeit bis zum Kerzenschluss verbleibt, was für das Timing Ihrer Einstiege unerlässlich ist.
Wie man handelt (Strategiebeispiel)
- Dashboard prüfen: Stellen Sie sicher, dass höhere Zeitrahmen (z. B. H1, H4) übereinstimmen (Grün/Rot). Vermeiden Sie das Trading, wenn sie "Neutral" (Grau) anzeigen.
- Auf das Signal warten: Achten Sie auf einen Kreuzungspfeil in Richtung des Haupttrends.
- Mit Price Action bestätigen: Verwenden Sie die "Swing High/Low"-Punkte, um die Marktstruktur zu bestätigen.
- Einstieg & Verwaltung: Einstieg beim Kerzenschluss. Verwenden Sie die EMA-Wolke als dynamische Unterstützung, um Ihren Stop Loss nachzuziehen.
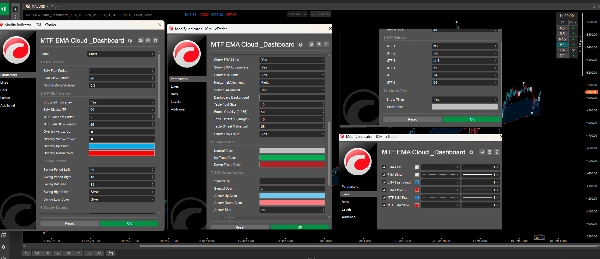
Anpassung
Der Indikator ist hochgradig anpassbar, um Ihrem Stil zu entsprechen:
- Passen Sie die EMA-Perioden für den aktuellen und MTF-Modus an.
- Ändern Sie die Farben für Wolken, Pfeile, Swings und das Dashboard.
- Konfigurieren Sie die Position und Transparenz des Dashboards.
- Schalten Sie jede Funktion unabhängig ein oder aus.
Zusammenfassung
A smart dashboard displays trend status across six timeframes (from 3 minutes to daily), incorporating a neutral zone logic that highlights flat or consolidating markets to help avoid false signals. The dashboard is interactive, enabling quick chart switching by clicking on timeframe buttons. The tool automatically marks swing high and low points to assist in setting stop loss and take profit levels based on recent price structure. Visual crossover arrows signal EMA fast and slow line crossovers, with customizable colors and styles. Additionally, a candle timer shows the remaining time until the current candle closes, aiding precise trade timing.
The indicator is highly customizable, allowing adjustments to EMA periods, colors, dashboard position, transparency, and feature toggling to fit individual trading styles. It supports markets including Forex, Crypto, and commodities like gold (XAUUSD), and is tagged for use with symbols such as BTCUSD and USDJPY.
Kundenbewertungen
5 | 0 % | |
4 | 100 % | |
3 | 0 % | |
2 | 0 % | |
1 | 0 % |


