
Bollinger Bands Advanced
مؤشر
2 عمليات الشراء
الإصدار 1.0، Apr 2026
Windows, Mac
4.0
التقييمات: 3

32
المبيعات
991
التثبيتات المجانية
الوصف
نظام بولينجر باندز المتقدم للضغط والانفجار
مؤشر بولينجر باندز هو عنصر أساسي للمتداولين في تقلبات السوق، لكن الأشرطة القياسية تفتقد إلى سياق حاسم: هل السوق يضغط؟ هل الاتجاه قوي بما يكفي للركوب عليه؟ هل الحركة مفرطة؟
مؤشر بولينجر المتقدم يحول الأشرطة القياسية إلى نظام تداول بصري عالي المستوى واحترافي. من خلال تقديم مناطق عمل مزدوجة (السحب)، وكاشف ضغط تقلب تلقائي، وأشرطة ذكية، يمنحك ميزة كبيرة في التقاط الانفجارات القوية وتوقيت الدخول المثالي للارتداد المتوسط.
الميزات الرئيسية
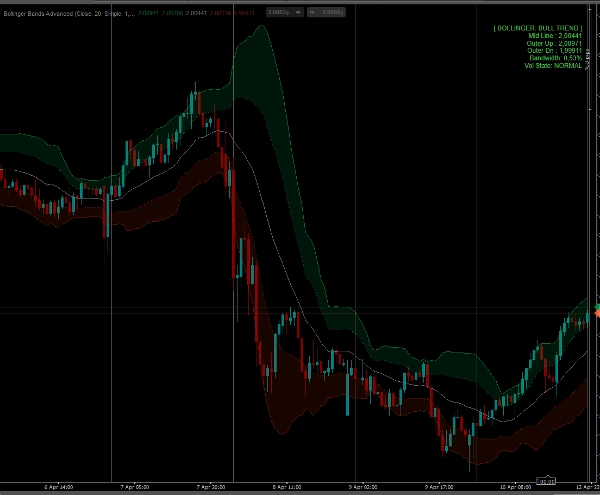
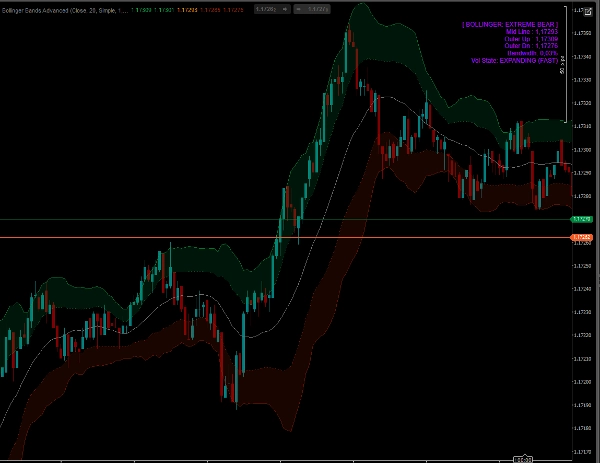
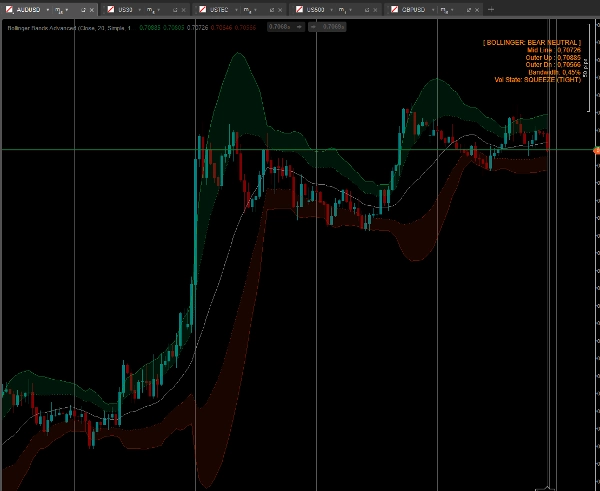
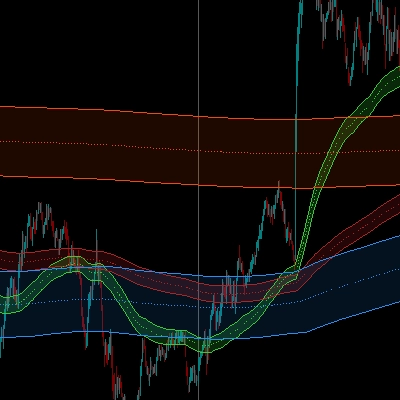
- نظام سحابة مزدوجة الأشرطة (مناطق العمل): بدلاً من شريط خارجي واحد، يرسم هذا المؤشر شريطًا داخليًا (مثلاً، انحراف معياري 1) وشريطًا خارجيًا (مثلاً، انحراف معياري 2). المساحة بينهما مظللة كسحابة.
-
- السعر داخل السحابة؟ أنت في "منطقة الاتجاه". اركب الزخم!
- السعر بين الخط الأوسط والشريط الداخلي؟ أنت في "المنطقة المحايدة". انتظر الإعداد.
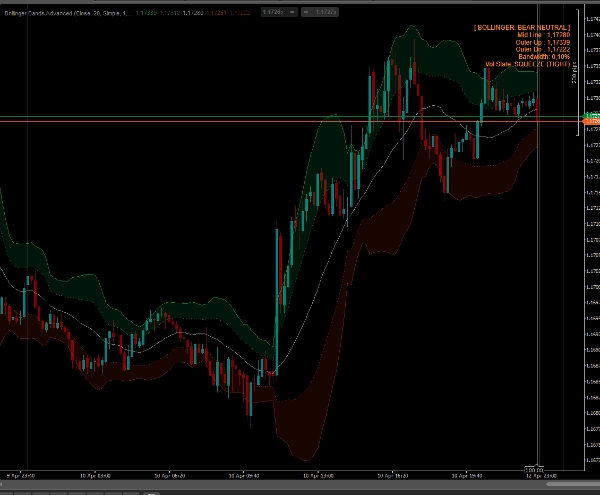
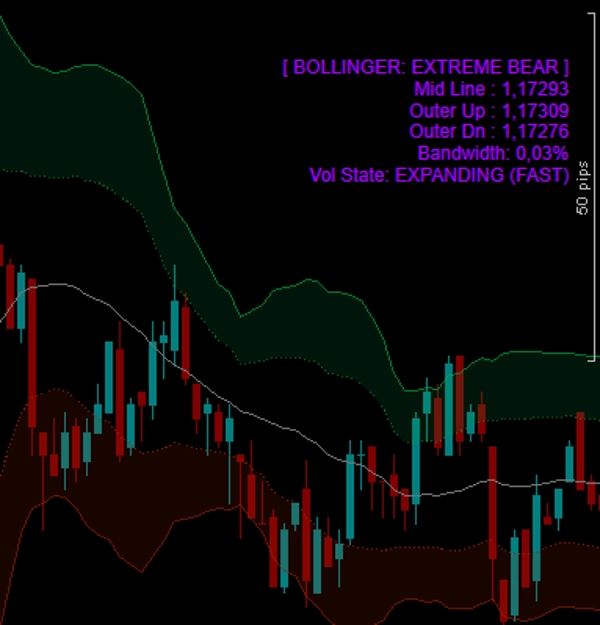
- كاشف الضغط التلقائي: يحسب المؤشر باستمرار عرض نطاق بولينجر ويقارنها بمتوسط متحرك تاريخي. ستومض لوحة المعلومات على الرسم البياني بتنبيه برتقالي ساطع "ضغط (ضيق)" عندما تنقبض الأشرطة بشكل غير طبيعي، محذراً من انفجار وشيك!
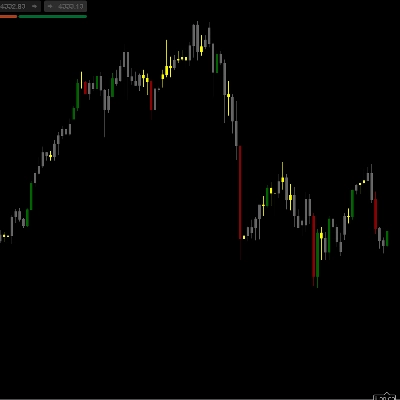
- تلوين الأشرطة الذكية (Paintbars): تتغير أشرطة الشموع الخاصة بك بناءً على التقلب وموقع الشريط:
-
- البنفسجي النيون/الماغنتا (شديد): يغلق السعر خارج الشريط الخارجي. علامة على انفجار ضخم أو ذروة مفرطة.
- الأخضر/الأحمر الساطع (الاتجاه): السعر يدفع بنشاط داخل منطقة عمل السحابة.
- الأخضر/الأحمر الداكن (محايد): السعر يتراجع نحو المتوسط المتحرك.
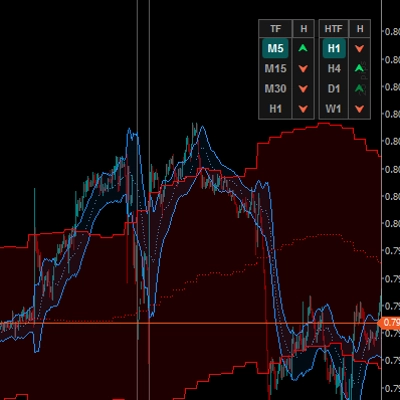
- لوحة معلومات مباشرة على الرسم البياني: تعرض لوحة أنيقة مستويات الأشرطة الدقيقة، ونسبة عرض النطاق الحالية، وحالة السوق، وحالة التقلب (ضغط، طبيعي، أو توسع).
- مفتوح بالكامل: تداول على أي رمز (فوركس، كريبتو، مؤشرات، أسهم) وأي إطار زمني بدون قيود. وصول مدى الحياة.
كيف تتداول به؟
- الانفجار (لعبة الضغط): انظر إلى لوحة المعلومات. عندما تقول حالة التقلب "ضغط"، السوق يخزن الطاقة. انتظر شمعة تخترق منطقة السحابة وتلوّن بالأخضر/الأحمر الساطع. هذا هو الزناد للدخول في انفجار عالي الزخم.
- ركوب الاتجاه: ابق في تداولك طالما ظلت الشموع بالأخضر/الأحمر الساطع وتلتصق بالسحابة الخارجية.
- الارتداد المتوسط: عندما يدفع اتجاه طويل السعر خارج الشريط الخارجي تمامًا (تتحول الشمعة إلى البنفسجي) وتقول لوحة المعلومات "توسع (سريع)"، السوق مبالغ فيه. ابحث عن حركة سعر عكسية نحو الخط الأوسط.
الملخص
ملخص الذكاء الاصطناعي
Bollinger Bands Advanced is a volatility indicator designed to enhance traditional Bollinger Bands by providing deeper market context for trading decisions. It features a Dual-Band Cloud system that shades the area between an Inner Band (e.g., 1 standard deviation) and an Outer Band (e.g., 2 standard deviations), defining distinct market zones: the Trend Zone (price inside the Cloud) and the Neutral Zone (price between the mid-line and Inner Band).
An automatic Volatility Squeeze Detector monitors Bollinger Bandwidth against historical averages and signals a "SQUEEZE (TIGHT)" alert on an on-chart dashboard when volatility contracts, indicating potential explosive breakouts. Candlesticks are color-coded with Smart Paintbars to reflect volatility and band position: neon purple/magenta for extreme moves outside the Outer Band, bright green/red for active trend momentum inside the Cloud, and dark green/red for neutral pullbacks toward the moving average.
The real-time dashboard displays band levels, bandwidth percentage, market state, and volatility state (Squeezing, Normal, Expanding). The indicator supports all symbols and timeframes across Forex, Crypto, Indices, and Stocks without limitations. Trading strategies include breakout entries during squeezes, trend riding within the Cloud, and mean reversion when price is overextended beyond the Outer Band.
ملف تعريف المؤشر
فئة المؤشر
التقلب
نوع المخرجات
الإشارات
التصور
فلتر
متطلبات البيانات
أعمدة السعر فقط
الإشارات المدعومة
الانقطاع
قوة الاتجاه
التقلب
مناقشة
تقييمات العملاء
4.0
التقييمات: 3
5 | 0 % | |
4 | 100 % | |
3 | 0 % | |
2 | 0 % | |
1 | 0 % |
تقييمات العملاء
April 20, 2026
demo first, then maybe small size if the notes look sane. The setup needs patience.
April 18, 2026
April 13, 2026
الأسئلة الشائعة
Bollinger Bands
Channel
ATR
يتم توفير المنتجات المتاحة من خلال cTrader Store، بما في ذلك روبوتات التداول والمؤشرات والإضافات، من قبل مطوري الطرف الثالث وإتاحتها لأغراض الوصول المعلوماتي والفني فقط. cTrader Store ليس وسيطًا ولا يقدم نصائح استثمارية أو توصيات شخصية أو أي ضمان للأداء المستقبلي.









السعر
32
المبيعات
991
التثبيتات المجانية