
LT_SmartSwings
مؤشر
6 عمليات الشراء
الإصدار 1.0، Jun 2025
Windows, Mac
5.0
التقييمات: 1
الوصف
ملاحظة: تم الاختبار على cTrader لنظام ويندوز فقط.
LT_SmartSwings هو مؤشر قوي يعتمد على هيكل السوق المتأرجح مصمم لمساعدة المتداولين على تصور نقاط التحول الرئيسية، وحركات السوق، وأحداث الاختراق بوضوح ومرونة. تم بناؤه للدقة والقدرة على التكيف، هذه الأداة مثالية للمتداولين الذين يعتمدون على منطق التأرجح، وتلاقي فيبوناتشي، وتحليل الاختراق.
الميزات الأساسية:
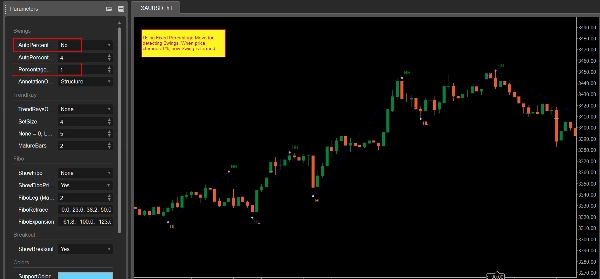
- كشف القمم والقيعان المتأرجحة بناءً على نسبة حركة السعر
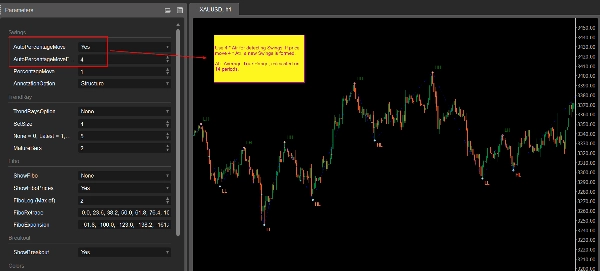
- العتبة التلقائية أو اليدوية: استخدم نسبة ثابتة أو الوضع التلقائي (بناءً على ATR × العامل)
- خط ZigZag يربط التأرجحات الرئيسية
- تعليقات تفصيلية مع 5 أوضاع:
-
- الهيكل: HH, HL, LH, LL
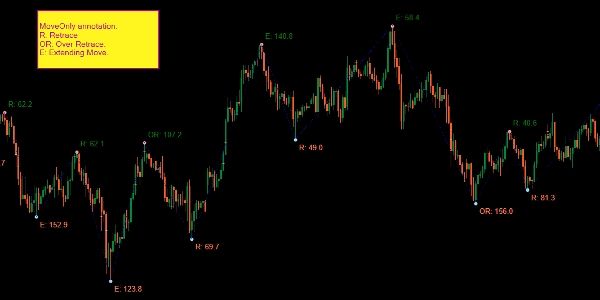
- الحركة فقط: نسب التراجع (R) والتمدد (E)
- السعر فقط
- الحركة والسعر
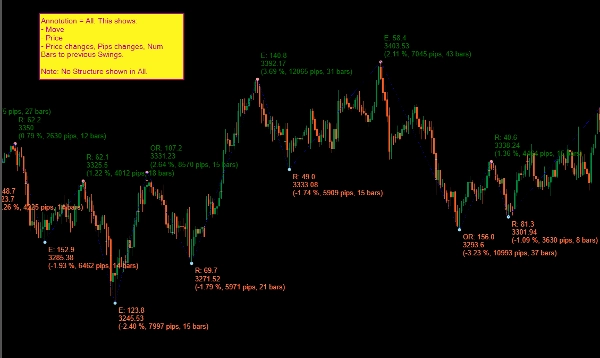
- الكل: نسبة الحركة، النقاط، الأعمدة، السعر، نوع الحركة
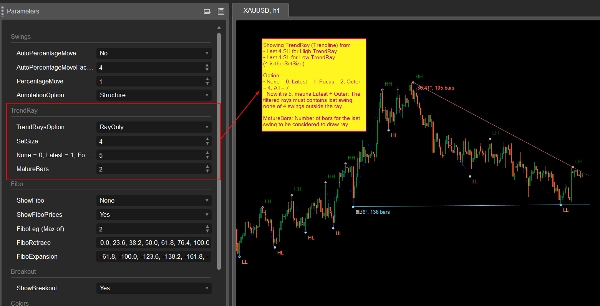
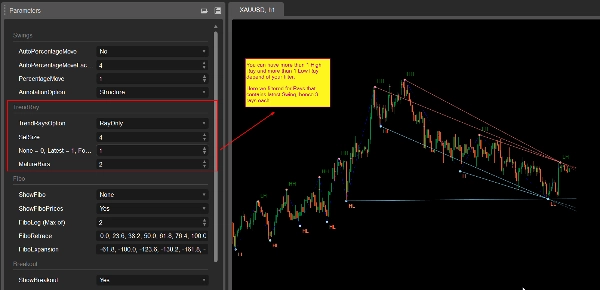
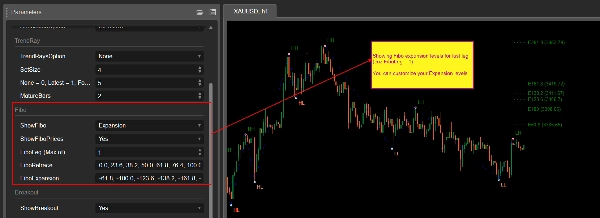
- إسقاط أشعة الاتجاه (مع خيارات تصفية متعددة):
-
- يرسم أشعة من التأرجحات الأخيرة باستخدام قيود ذكية
- خيارات: الأحدث، التركيز (الميل)، الخارجي، أو الكل
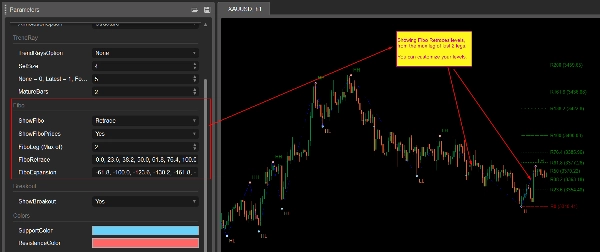
- مستويات فيبوناتشي التلقائية:
-
- يرسم مستويات التراجع أو التوسع بناءً على الحركات الأخيرة
- مجموعات مستويات قابلة للتكوين من قبل المستخدم
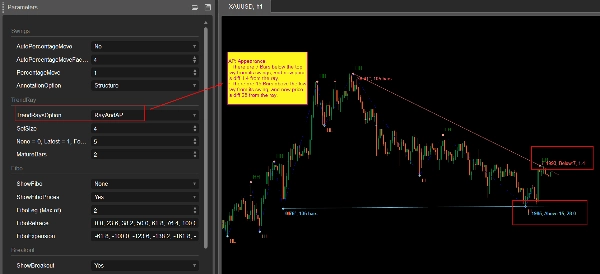
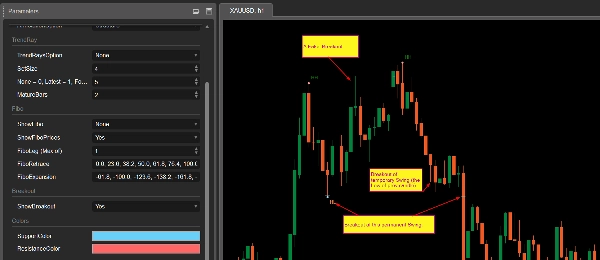
- تمييز الاختراق:
-
- يكشف اختراق نقاط التأرجح (كلا الاختراقات المؤكدة والكاذبة)
- عرض مستمر للرجوع التاريخي
- تخصيص الألوان لخطوط الدعم/المقاومة
حالات الاستخدام:
- تحديد الدعم/المقاومة ديناميكيًا
- فهم هيكل التأرجح والانتقالات
- رصد استمرار الاتجاه أو الانعكاس باستخدام فيبوناتشي
- تصور نقاط الاختراق لتخطيط التداول
- الدمج مع أنظمتك الحالية أو الاستراتيجية التقديرية
الاستخدام الموصى به:
- اربطه بإطارك الزمني العامل (مثل M30، H1)
- مناسب بشكل أفضل للمتداولين اليدويين، محللي الهيكل، والاستراتيجيات القائمة على التأكيد
عرض الإطلاق: متاح الآن بسعر 15 دولار فقط!
الملخص
ملخص الذكاء الاصطناعي
LT_SmartSwings is a swing-based market structure indicator designed for traders to identify key turning points, market moves, and breakout events with precision and flexibility. It detects swing highs and lows based on price movement percentage, using either fixed or automatic thresholds derived from ATR. The indicator connects key swings with a ZigZag line and provides detailed annotations in five modes, including structure (HH, HL, LH, LL), move percentages, price-only, combined move and price, and comprehensive move data.
Additional features include trend ray projection with multiple filtering options, automatic Fibonacci retracement and expansion levels customizable by the user, and breakout marking that detects both confirmed and false breakouts with persistent historical display. Support and resistance lines can be color-customized.
Use cases cover dynamic support/resistance identification, understanding swing structure and transitions, spotting trend continuation or reversal via Fibonacci levels, visualizing breakout points for trade planning, and integration with existing trading systems or discretionary strategies. It is recommended for manual traders, structure analysts, and confirmation-based strategies, and is intended for use on working timeframes such as M30 or H1. The indicator has been tested on cTrader Windows.
ملف تعريف المؤشر
تقييمات العملاء
5.0
التقييمات: 1
5 | 100 % | |
4 | 0 % | |
3 | 0 % | |
2 | 0 % | |
1 | 0 % |
مناقشة
الأسئلة الشائعة
Breakout
ATR
يتم توفير المنتجات المتاحة من خلال cTrader Store، بما في ذلك روبوتات التداول والمؤشرات والإضافات، من قبل مطوري الطرف الثالث وإتاحتها لأغراض الوصول المعلوماتي والفني فقط. cTrader Store ليس وسيطًا ولا يقدم نصائح استثمارية أو توصيات شخصية أو أي ضمان للأداء المستقبلي.


السعر
منذ 25/09/2024
34
المبيعات