
الوصف
ملاحظة: تم الاختبار على cTrader لنظام ويندوز فقط.
LT_Ind_Pivot هو مؤشر نقطة محورية قوي وقابل للتخصيص لـ cTrader يساعد في تصور مستويات السوق الرئيسية وهياكل الجلسات عبر أطر زمنية متعددة.
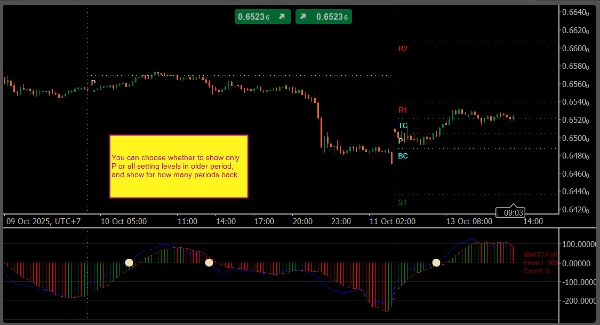
يقوم تلقائيًا بحساب ورسم النقطة المحورية (P)، الدعم (S1–S5)، المقاومة (R1–R5)، و CPR (TC/BC) بناءً على الإطار الزمني الأساسي الذي تختاره — من H1, H4, H8, H12, D1, W1, إلى Month1.
يرسم المؤشر أيضًا خطوط فصل رأسية لكل فترة أساسية، سواء على الرسم البياني الرئيسي أو لوحات المؤشرات، مما يسهل التمييز بين حدود الجلسات أو الفترات.
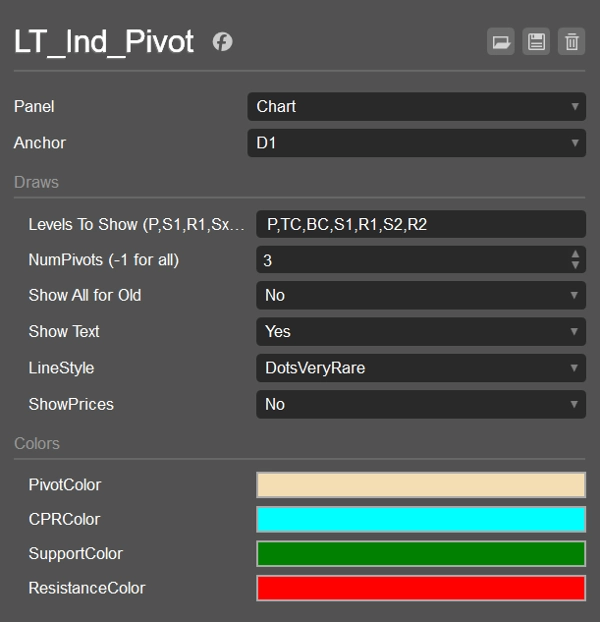
يمكنك تحديد المستويات التي تريد عرضها بدقة باستخدام تدوين مرن مثل:
P, S1, R1– المستويات القياسيةPS1،S1S2،R1R2، إلخ – المستويات الوسطى بين النقاط المحورية والدعوم/المقاومات الرئيسيةTC،BC– نطاق النقطة المحورية المركزية (CPR)
تتيح لك عناصر التحكم في العرض تعيين عدد النقاط المحورية التاريخية التي تبقى مرئية، سواء لعرض تسميات النص/السعر، وكيفية تلوين أو تنسيق كل مستوى.
الميزات الرئيسية
- مراسي النقاط المحورية: H1, H4, H8, H12, D1, W1, Month1
- بناء جملة المستوى المخصص:
P, Sx, Rx, PS1, S1S2, R1R2, TC, BC - خطوط فصل رأسية على الرسم البياني ولوحات المؤشرات
- خيار عرض النصوص والأسعار ومستويات النقاط المحورية القديمة
- تخصيص كامل للألوان وأنماط الخطوط
- خفيف الوزن ومناسب للتداول المباشر
الإعدادات الافتراضية
- الإطار الأساسي: D1
- عرض المستويات:
P,S1,R1 - عدد النقاط المحورية السابقة: 1
- عرض الكل للنقاط المحورية القديمة: false
- عرض النص: true
- عرض الأسعار: false
- نمط الخط: Solid
- الألوان: النقطة المحورية = Wheat، CPR = Cyan، الدعم = Green، المقاومة = Red
حالات الاستخدام
- تمييز مناطق الدعم/المقاومة اليومية والمتأرجحة
- تتبع CPR والمستويات الوسطى لإعدادات الاختراق أو الارتداد نحو المتوسط
- استخدام خطوط الفصل لتحليل هيكل الجلسة جلسة بجلسة
- الدمج مع مؤشرات VWAP أو Swing لتحقيق توافق أعلى
الملخص
تقييمات العملاء
5 | 0 % | |
4 | 100 % | |
3 | 0 % | |
2 | 0 % | |
1 | 0 % |


