
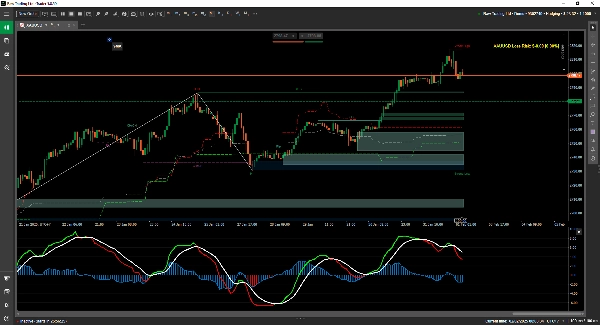
SmartBot-Volume MACD
مؤشر
5 عمليات الشراء
الإصدار 1.0، Feb 2025
Windows, Mac
4.3
التقييمات: 3
الوصف
🚀 تقديم مؤشر حجم MACD – المؤشر النهائي للاتجاه والزخم! 🚀
ارتق بتداولك إلى المستوى التالي مع حجم MACD، مؤشر ثوري يدمج الحجم في MACD، موفراً تأكيدات أقوى، دقة أفضل، ورؤى أعمق للسوق. هذه هي التوليفة المثالية لتحديد الاتجاهات القوية وتحولات الزخم!
🔥 لماذا حجم MACD؟ 🔥
✅ دقة محسنة: يجمع بين قوة الاتجاه وتأكيد الحجم.
✅ إشارات أقوى: تصفية التحركات الضعيفة وتحديد الإعدادات ذات الاحتمالية العالية.
✅ مثالي لأي سوق: يعمل على الأسهم، الفوركس، العملات الرقمية، وأكثر.
قم بترقية استراتيجيتك مع حجم MACD وابدأ التداول بثقة ودقة! 📊🚀
الملخص
ملخص الذكاء الاصطناعي
Volume MACD is a technical indicator that integrates volume data into the traditional MACD (Moving Average Convergence Divergence) to enhance trend and momentum analysis. By combining trend strength with volume confirmation, it aims to provide stronger signal confirmations, improved accuracy, and deeper market insights. This integration helps filter out weak price movements and identify high-probability trading setups. Volume MACD is designed for use across various markets, including stocks, forex, and cryptocurrencies, making it a versatile tool for traders seeking to identify powerful trends and momentum shifts.
ملف تعريف المؤشر
تقييمات العملاء
4.3
التقييمات: 3
5 | 33 % | |
4 | 67 % | |
3 | 0 % | |
2 | 0 % | |
1 | 0 % |
تقييمات العملاء
February 4, 2025
Realistic chart layer if the trader wants it adds useful information behind the price move. It works best as support, not a final decision maker. Volume context is stronger when POC, VWAP and value area agree across 2 sessions. volume alone can be noisy without price action.
February 3, 2025
February 3, 2025
Balanced execution aid for traders who want confirmation beyond candles. It gives value around volume based context, but volume alone can be noisy without price action. I would review 20 reactions near POC or VWAP before trusting the read. The data helps most when price action confirms the same zone.
مناقشة
الأسئلة الشائعة
Forex
Crypto
Stocks
MACD
يتم توفير المنتجات المتاحة من خلال cTrader Store، بما في ذلك روبوتات التداول والمؤشرات والإضافات، من قبل مطوري الطرف الثالث وإتاحتها لأغراض الوصول المعلوماتي والفني فقط. cTrader Store ليس وسيطًا ولا يقدم نصائح استثمارية أو توصيات شخصية أو أي ضمان للأداء المستقبلي.


![شعار "Gaussian Channel [Iridio Capital]"](https://cdn.ctrader.com/image/webp/7c039209-5573-4a54-a072-f9528b503103_41960)


السعر
منذ 29/11/2024
32
المبيعات
969
التثبيتات المجانية