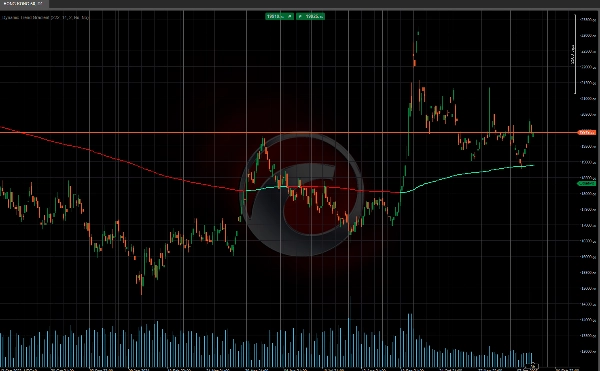
ブローカー&プロップファーム
事業者向け
00
Days
:
00
Hours
:
00
Minutes
:
00
Seconds
インジケーター
RSI
Breakout
Signal
Supertrend
Dynamic Trend Gradient
03/09/2025
1
Desktop
登録日 03/10/2024
販売
120
無料インストール
22950
「Dynamic Trend Gradient」アップロード画像

📈 This indicator is a tool that helps us identify and visualize the direction of the trend in a price chart. 📊 Its operation is based on the calculation of trend levels using exponential moving averages and a measure of volatility to determine the zones where the price is expected to move. Below, I’ll explain in detail how it works:

📐 Calculation of Trend Levels

The indicator starts by calculating what is called the "basis level." This level is obtained by averaging two exponential moving averages: one short-term (based on a user-defined length, in this case, 222) and one long-term (double the length of the first). These averages give us a reference for the overall trend.

Next, volatility is calculated using the standard deviation of the closing prices, and this value is smoothed with an additional exponential moving average. The smoothed volatility is multiplied by a parameter called "sensitivity," which gives us the upper and lower levels around the basis level. These levels act as trend bands and help identify whether the price is above or below the trend.

📉📈 Trend Status

With these levels calculated, the indicator evaluates the trend status in the market. If the price is above the basis level, it assumes a bullish trend 🐂, and if it’s below, the trend is bearish 🐻. If the price crosses the upper or lower levels, the indicator changes its trend signal, indicating a possible reversal or shift in market momentum.

This tool is perfect for traders looking to stay ahead of market trends! 🚀📉📈


Ctrader Store indicators:


Channel Breakout System

Fair Value Gap Sessions

 BOS & CHOCH

ZigZag

Supertrend

Market Imbalance

Adaptive Trend Channel 

Dynamic Market Structure
Analysis of Turning Points

Order Block

Fibonacci Linear
Regression Multi-timeframe

Volume POC Heatmap

Dynamic RSI

Momentum Fair Value Gap

Market Flow Projection

Dynamic Trend Gradient

Multi-Level Candle Bias
Tracker

Zig-Zag Extremity Tracker

Reactive Moving Average

Auto-Trend Channel

Auto Support and
Resistance Trend Lines

All Support and
Resistance Levels

Leverage Liquidation Map

Zones Supply Demand

Dynamic Range Momentum

0.0
レビュー: 0
カスタマーレビュー
この商品にはまだレビューがありません。お使いになったことがある方は、ぜひレビューをお願いします。
この作成者の他の商品
トップ評価
無料
インジケーター
RSI
Breakout
XAUUSD
+6
ZigZag
ZigZag filters noise, spots trends, patterns, pivots, aiding analysis, trade management, and confirmations. 📉📈
インジケーター
RSI
Breakout
XAUUSD
+6
Order Block
Identify bullish and bearish Order Blocks to spot key support/resistance levels and potential trend reversals! 📈🔄
インジケーター
RSI
Breakout
XAUUSD
+5
Auto-Trend Channel
Adaptive trend channel using linear regression and Pearson correlation for dynamic support, resistance, and trends.
インジケーター
RSI
XAUUSD
Breakout
+5
BOS & CHOCH
Market structural patterns , specifically the concepts of Change of Character (ChoCH) 🔄 and Break of Structure (BoS) 💥
インジケーター
RSI
Breakout
XAUUSD
+6
Volume POC Heatmap
📊 Shows volume by price levels, highlights POC, and key zones. Identifies dynamic support/resistance and imbalances.
インジケーター
RSI
Breakout
Supertrend
All Support and Resistance Levels
"Identify key market zones and visualize support/resistance from multiple timeframes on a single chart.
インジケーター
RSI
Breakout
XAUUSD
+5
Zones Supply Demand
📊Zones Supply & Demand: Identifies key price levels with high volume concentration, marking Supply/Demand Zones & Marke
インジケーター
RSI
Breakout
XAUUSD
+5
Supertrend
💹 Define a price channel 📈 and determine trend direction (bullish 🟢 or bearish 🔴).
インジケーター
RSI
Breakout
XAUUSD
+6
Fair Value Gap Sessions
identify and highlight temporary market inefficiencies known as "fair value gaps" 🚨 within specific trading Sessions.
インジケーター
RSI
Breakout
XAUUSD
+4
Dynamic Market Structure Analysis of Turning Points
Identify market structure effortlessly with swing highs, lows, CHoCH, and BOS levels for smart trading decisions! 📊🔍"
インジケーター
Indices
RSI
XAUUSD
+7
RSI Divergence
Detects bullish and bearish divergences
インジケーター
RSI
Breakout
Supertrend
Trend Heikin Multi MA
🚀 TrendHeikinMultiMA: Advanced trend detection using Heikin-Ashi smoothing & MAs! Eliminates noise, confirms real trend
インジケーター
RSI
Breakout
XAUUSD
+4
Multi-Level Candle Bias Tracker
Price direction by calculating the probability of reaching new highs/lows. Shows levels & stats📈
インジケーター
RSI
Breakout
Supertrend
Leverage Liquidation Map
📊 Liquidation Map: Potential areas where highly leveraged investors might face liquidations.
インジケーター
RSI
Breakout
Supertrend
Swing Levels
🔍 Automatically detect support and resistance levels based on "swings" or pivots
Advanced Market Structure Bos,Choch,SwinLevels, Order Blog
Advanced price action tool that combines multiple technical analysis concepts
インジケーター
RSI
Breakout
Supertrend
Market Trend OB
Price action to detect when the market changes trend (MSB) and defines, order blocks , ZigZag etc.📊
インジケーター
RSI
Breakout
Supertrend
Zig-Zag Extremity Tracker
Dynamically adjusts regression channels based on ZigZag extremes, resetting when price breaks bands to track real trends
これも好きかも
インジケーター
Indices
RSI
Commodities
+1
OrderPrice-V3
A straightforward yet effective tool signals entry points for both buying and selling. Include 3 Moving Average
Bar Explosion
cTrader indicator with mini-timeframe candlesticks. Customize timeframe, colors, margins. Perfect for traders.
インジケーター
NAS100
NZDUSD
XAUUSD
+10
Tsunami Volume Surge - RVOL
🌊 See when the market is truly in play. Tsunami measures Relative Volume by time-of-day 🌊
トップ評価
無料
インジケーター
ATR
Forex
Signal
+4
Follow Line
The Follow Line Indicator is a versatile tool designed to identify market trends and provide accurate buy/sell signals.
インジケーター
NAS100
Indices
XAUUSD
+9
HAIQuantum_TheGameV2
This trading game allows you to explore and practice investment strategies in a real-time market data environment.
Candle Timer & Strength Demo
Candle Timer & Strength DEMO for cTrader This is a DEMO version of the Candle Timer & Strength indicator. You can use al
インジケーター
NAS100
NZDUSD
Martingale
+22
Indicators Volume Profile 1
Taiz Pro Volume Profile مؤشر احترافي لتحليل الحجم (Volume Profile) يكشف عن مناطق الدعم والمقاومة الحقيقية التي يركز عليه
インジケーター
Signal
MACD
USDJPY
PulseTracker
Version 1.2: Advanced Trend Detection & Visualization System
ZigZag Price Liquidity Projection
📊 ZigZag Liquidity Projection: Predict bounces/breaks using pivots, ATR & volume.
インジケーター
NAS100
NZDUSD
XAUUSD
+14
Volume Profile Pivot Anchored
Anchor volume profiles to pivots with POC, VAH, VAL and real-time insights for clearer trade decisions.
インジケーター
Indices
Breakout
Commodities
+3
Daily Levels
The "Daily Levels" indicator is used to display last week's and yestoday high/low price
インジケーター
Indices
Breakout
XAUUSD
+5
VQTX 2026 ULTRA
🚀 VQTX Indicator - The Ultimate Volatility & Trend Analysis Tool 🚀
vpdi
VPDI (open, close, high and low with % of the previous day and price changes in % of the previous day's close)
インジケーター
NAS100
NZDUSD
XAUUSD
+8
Squeeze Breakout Regression System
💥Detects moments when the market is "compressed" and about to explode in any direction 💥
インジケーター
XAUUSD
Forex
EURUSD
+2
ALMA Smoothed Gaussian Moving Average
ALMA Smoothed Gaussian Moving Average (ASGMA) – by LudwigICT
Advanced Regression Channel
Regression channels with Fibonacci levels across multiple regression types, timeframes, and custom date ranges.
インジケーター
Indices
RSI
Signal
+2
[Stellar Strategies] Ultimate Trend & Momentum Dashboard
A comprehensive cTrader indicator designed to give you a quick, at-a-glance understanding of market sentiment 📈📉