説明
Pinescriptlabs ストアインジケーター: Pinescriptlabs ストア cBots : (cBot) Gold & BTC ブレイクアウトセッションピボット(新着)
この RSI ダイバージェンス は、価格と相対力指数(RSI)間のダイバージェンスを検出するために設計された高度なテクニカル分析ツールです。これらのダイバージェンスは、市場の方向性の変化を予測できる強力なシグナルであり、テクニカルトレーダーにとって非常に価値のあるリソースとなります。🔍💡
⚙️ どのように機能しますか?
このインジケーターは、価格 と RSI が常に同期して動くわけではないという原理に基づいて動作します。ダイバージェンスが発生すると、それは価格が基礎となるRSIトレンドとは逆のシグナルを送っていることを意味します。これは現在のトレンドが勢いを失いつつある可能性のある早期警告となり得ます。
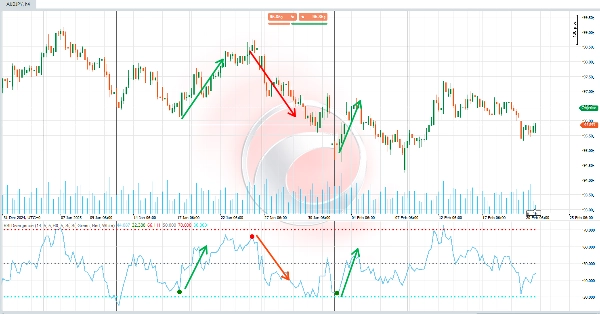
- 強気のダイバージェンス(上昇トレンド)📈 :
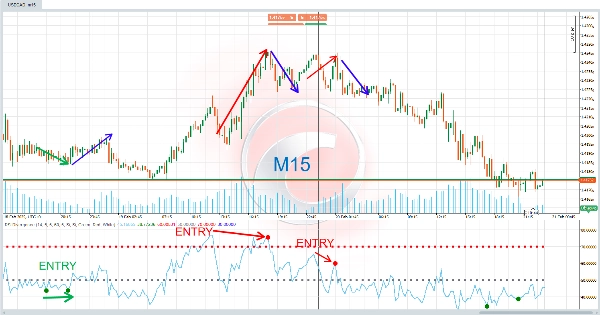
価格が安値を切り下げる一方で、RSIは安値を切り上げる場合に発生します。これは、価格が下落しているにもかかわらず、上昇の勢いが強まっている可能性があり、上昇反転につながることを示唆しています。✅ - 弱気のダイバージェンス(下降トレンド)📉 :
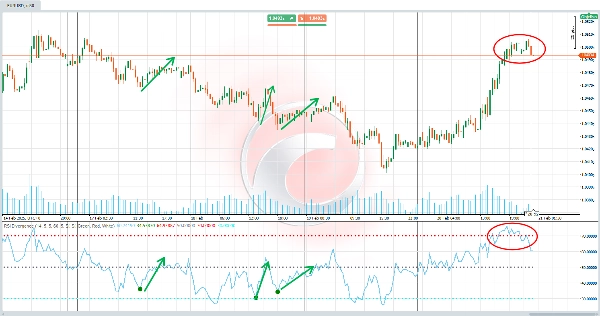
価格が高値を切り上げる一方で、RSIは高値を切り下げる場合に発生します。これは、価格が上昇しているにもかかわらず、下降の勢いが強まっている可能性があり、下降反転につながることを示唆しています。❌
インジケーターはこれらのダイバージェンスを自動的に検出し、チャート上に色、ライン、ラベルで強調表示して解釈を容易にします。🎯
💡 何に使うのですか?
このインジケーターは特に以下に役立ちます:
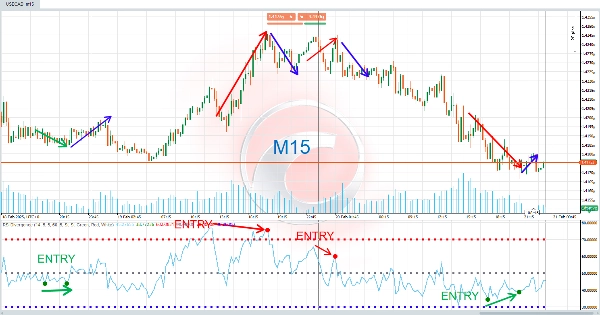
- エントリーとエグジットポイントの特定 : ダイバージェンスは買い(強気)または売り(弱気)のシグナルとして機能します。🛒💸
- トレンド変化の予測 : ダイバージェンスは現在のトレンドが勢いを失いつつあることを示す早期シグナルです。⚡
- テクニカル分析の確認 : 他のインジケーターやローソク足パターンと組み合わせて取引判断の検証に使えます。🧠📊
デイトレーダーにも長期投資家にも理想的で、ダイバージェンスはどのタイムフレームにも適用可能です。⏳📈
🛠️ 使い方は?
- 初期設定:
-
- RSI期間、ピボット検索範囲、シグナルカラーなど、ニーズに応じてパラメーターをカスタマイズします。🎨⚙️
- 強気または弱気のダイバージェンス表示を好みに応じて有効または無効にします。✅❌
- シグナルの解釈:
-
- 強気のダイバージェンス : チャート上に緑の「D」シグナルが表示された場合、買いの可能性を示します。🟩🛒
- 弱気のダイバージェンス : チャート上に赤の「D」シグナルが表示された場合、売りの可能性を示します。🟥🚫
- さらに、ダイバージェンスポイントを結ぶラインが描画され、視覚的分析を助けます。📐🔗
- 意思決定:
-
- これらのシグナルを使って、ポジションのオープン、既存取引のクローズ、ストップロスレベルの調整など、戦略を調整します。🤝💼
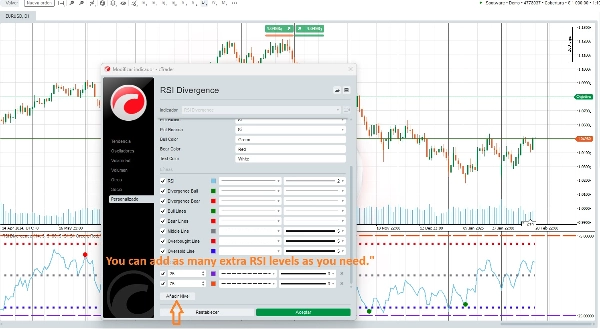
🆕 高度なカスタマイズ!
🌟 ユーザーが望むだけ多くのRSIレベルを追加可能 🌟
このインジケーターは取引体験を完全にカスタマイズできるようにします。複数のRSIレベルを追加して、異なる戦略や取引スタイルに適応させることが可能です。例えば、追加の買われ過ぎ・売られ過ぎレベルを設定したり、異なるタイムフレームに合わせてRSI期間を調整したりできます。🔄📈📉
概要
Designed for use on any timeframe, the indicator helps traders identify entry and exit points, anticipate trend changes, and confirm other technical analysis signals. Users can customize parameters such as RSI period, pivot search ranges, signal colors, and enable or disable specific divergence types. Additionally, multiple RSI levels can be added to tailor the indicator to various trading strategies and styles.
This tool is suitable for intraday traders and long-term investors across markets including cryptocurrencies (e.g., BTCUSD), commodities (e.g., gold, XAUUSD), and indices. It supports enhanced decision-making by providing early warnings of trend strength shifts based on RSI divergence analysis.
カスタマーレビュー
5 | 0 % | |
4 | 100 % | |
3 | 0 % | |
2 | 0 % | |
1 | 0 % |