
説明
📊 TrendHeikinMultiMA – 高度なトレンドアルゴリズム
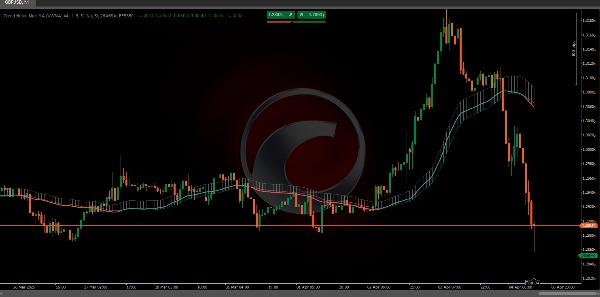
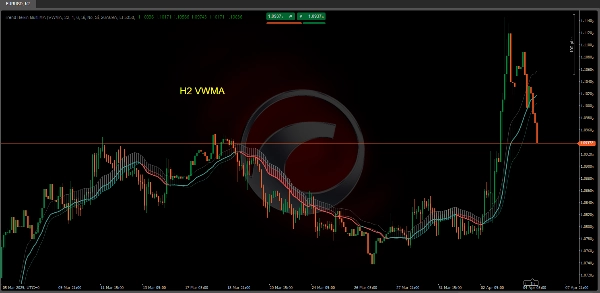
この TrendHeikinMultiMA アルゴリズムは、価格データから トレンド値 を計算するように設計されており、これらの値を平滑化するために 平均足の公式 を使用し、さらにさまざまな種類の移動平均(ALMA、HMA、SMA、SWMA、VWMA、WMA、ZLEMA、またはEMA)を適用します。
平均足の値は内部で使用されていますが、チャートには従来の平均足ローソク足は表示されません。代わりに、平滑化された値に基づいて トレンドライン を描画し、ローソク足チャートの視覚的な複雑さなしに市場の方向性をより解釈しやすくしています。
🔄 1. 平滑化の役割
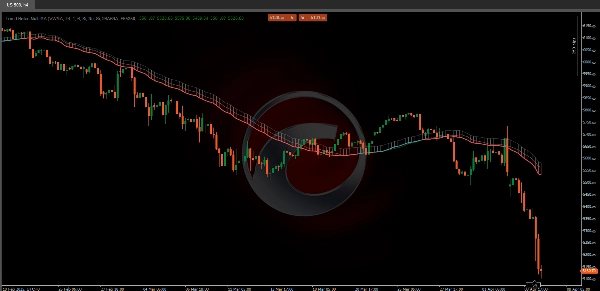
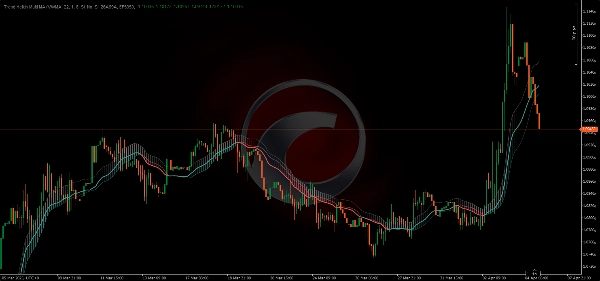
トレンド値は 平均足の平滑化 と移動平均を組み合わせて導出されるため、TrendHeikinMultiMA の 色の変化は 価格がトレンドラインを横切ったときにすぐには起こりません:
- 🔹 価格が一時的にトレンドラインの 上または下に動くことがあり、色の変化を引き起こさない場合があります。
- 🔹 これは、インジケーターが 平滑化された始値と終値の間に重要かつ持続的な 差異を待って、実際のトレンド反転を確認するためです。
✅ 解釈の利点
この 意図的な遅延 により、誤ったシグナルを回避 できます。従来の ローソク足チャート では、価格が一時的にトレンドラインを横切り、早すぎるシグナルを引き起こすことがあります。
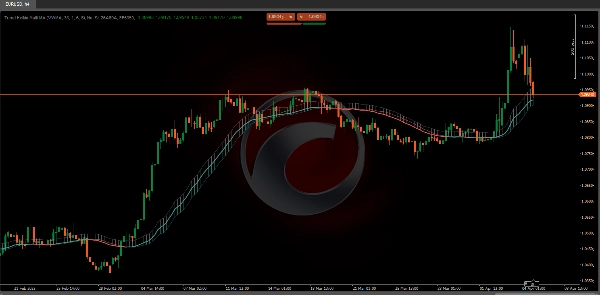
- 🟥 例えば、現在の価格が弱気のトレンドラインの上にあっても、インジケーターは 赤(弱気) のままで、平滑化された値が 終値が始値を一貫して上回っていることを確認するまで変わりません。
- 🟩 同様に、 緑(強気) に切り替えるには、平均足ベースの移動平均が 終値が始値を一貫して超えていることを確認する必要があります。
📈 2. 平均足の値に移動平均を適用する
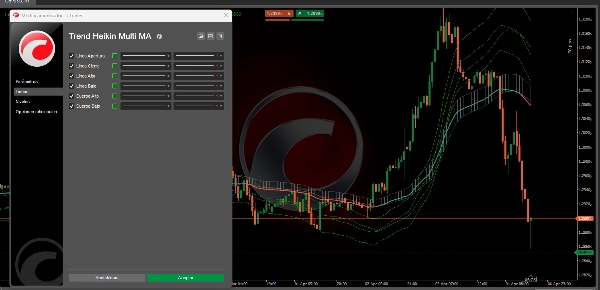
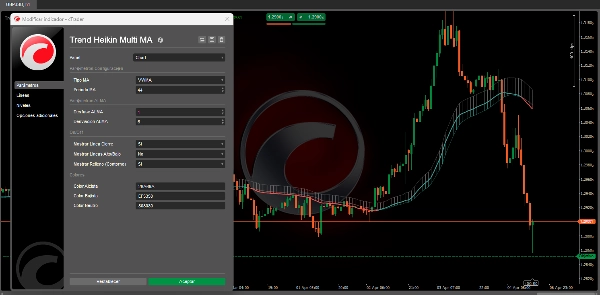
- 🔄 移動平均の選択:
-
- ユーザーは 異なる移動平均タイプから選択できます(ALMA、HMA、SMA、SWMA、VWMA、WMA、ZLEMA、およびEMA)。
- 各MAタイプは、平均足から導出された 始値、終値、高値、安値 の履歴値を重み付けし平滑化するための特定の数学的手法を適用します。
🏆 3. TrendHeikinMultiMAを従来のローソク足と比較した利点
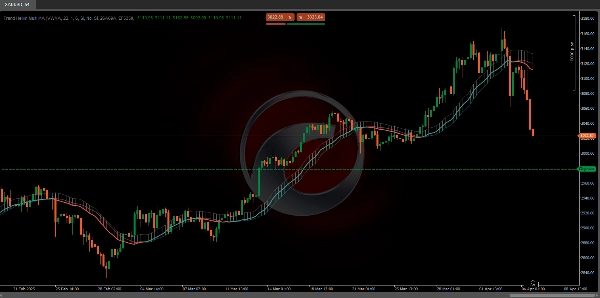
- 📉 ノイズの低減:
-
- 従来のローソク足はしばしば 高い変動性と散乱したデータ を表示し、全体のトレンドを識別しにくくします。
- TrendHeikinMultiMA はこのデータを平滑化し、小さな変動を除去し急激な変動を排除することで、トレーダーが主要な市場方向に集中できるようにします。
✅ 結論
まとめると、 TrendHeikinMultiMA は トレンドの変化(強気または弱気)を確認するのは、 平滑化された 始値と終値 が平均足から計算され、選択された 移動平均 を通じて処理され、一貫して 市場の動きが 方向転換したことを示す場合のみです。
これにより、シグナルの信頼性が高まり、従来のローソク足チャートで見られるノイズの影響が少なくなります。🚀📊
🔥 Pinescritlabs Ctrader Store インジケーター 🔥
Dynamic Market Structure
Analysis of Turning Points
Fibonacci Linear
Regression Multi-timeframe
Multi-Level Candle Bias
Tracker
Auto Support and
Resistance Trend Lines
All Support and
Resistance Levels
概要
The indicator incorporates a smoothing mechanism that delays color changes to confirm trend reversals only after a significant and sustained difference between smoothed open and close values is detected. This approach reduces false signals caused by brief price fluctuations crossing trend lines.
Users can select from multiple moving average types, each applying distinct mathematical weighting methods to the Heikin-Ashi-derived open, close, high, and low values, enhancing customization and adaptability to different trading styles.
Compared to traditional candlestick charts, Trend Heikin Multi MA filters out minor price fluctuations and abrupt swings, allowing traders to focus on primary market trends with more reliable signals. It confirms bullish or bearish trend changes only when smoothed values consistently indicate a market direction reversal, improving signal accuracy and reducing noise.
カスタマーレビュー
5 | 33 % | |
4 | 67 % | |
3 | 0 % | |
2 | 0 % | |
1 | 0 % |


