
説明
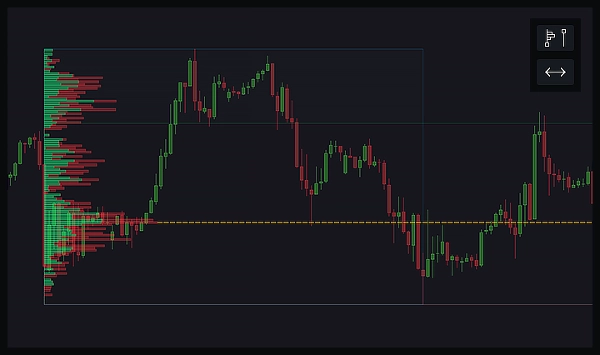
固定範囲ボリュームプロファイルは、チャート上の特定の範囲内で異なる価格レベルでどれだけの取引活動があったかを示すツールです。関心のあるエリアに長方形を描くと、その範囲内の各価格レベルでの取引量を示す水平バーが表示されます。これにより、最も多くの買いと売りが行われた場所がわかり、取引判断に重要な可能性のある主要な価格レベルが強調されます。
固定範囲ボリュームプロファイルの主な構成要素は以下の通りです:
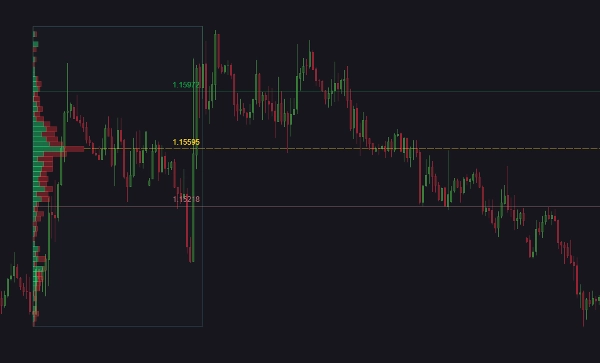
- コントロールポイント(POC): 選択した範囲内で最も取引量が多い価格レベル。多くの取引活動があった価格を反映しているため、重要なサポートまたはレジスタンスレベルと見なされることが多いです。
- バリューエリアハイ(VAH): 総取引量の70%が発生した価格範囲の上限。これを超える価格は取引量が少なく、過大評価されている可能性があります。
- バリューエリアロー(VAL): 総取引量の70%が発生した価格範囲の下限。これを下回る価格は取引量が少なく、過小評価されている可能性があります。
これらのラインは、トレーダーがサポートやレジスタンスとして機能する重要な価格レベルを特定するのに役立ちます。取引量が集中している場所を理解することで、トレーダーは価格の動き、エントリーおよびエグジットポイントに関してより情報に基づいた判断を下すことができます。
例えば、現在の価格がPOC付近にある場合、それは強力なサポートまたはレジスタンスレベルを示している可能性があります。価格がバリューエリア内にある場合は適正価格範囲内であることを示し、バリューエリア外の価格は潜在的なブレイクアウトまたはブレイクダウンポイントと見なされるかもしれません。
このインジケーターの機能:
このインジケーターは、強力なボリュームプロファイル分析とカスタマイズ可能なアラートで取引チャートを強化します。2つの直感的なボタンで、固定範囲のボリュームプロファイルを簡単に描画し、主要レベルを無限に拡大または縮小できます。ボリュームプロファイルは、合計バーまたはアップ・ダウンバーの2つのモードで視覚化可能です。レベル数、データ解像度(精密または高速)、バリューエリアのサイズをニーズに合わせて調整できます。
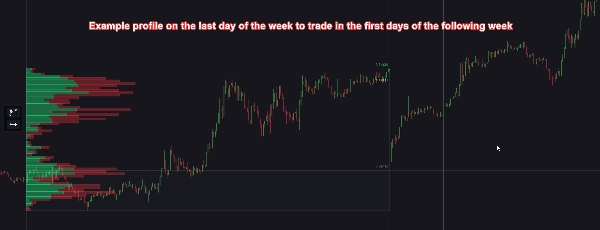
マグネティックレンジは最後のローソク足に基づいて自動的に更新され、分析を常に最新の状態に保ちます。POC、VAH、VALラインを含むプロファイルとその構成要素の外観や動作もカスタマイズ可能です。価格がラインに触れた際のアラートを設定でき、cBotの開始・停止やポジションのクローズなどのアクションをトリガーするオプションもあります。アラートは音声、cTraderのポップアップ、Telegramメッセージ(スクリーンショット付きオプションあり)、メールで受け取れます。
特徴:
- 固定範囲ボリュームプロファイル: 選択した範囲のボリュームプロファイルを視覚化するために長方形を描画します。
- ラインの拡大/縮小: POC、VAH、VALラインを無限に延長または縮小します。
- ボリュームプロファイルモード: 合計ボリュームまたはアップ・ダウンバーから選択できます。
- カスタマイズ可能なレベルと解像度: レベル数と解像度(精密または高速)を選択します。
- 調整可能なバリューエリア: バリューエリアのサイズを設定します。
- マグネティックレンジ: 最後のローソク足に合わせて範囲を自動調整し、1~10分ごとまたはバーのクローズ時に更新されます。
- カスタマイズ可能な外観: ボタン、ライン、ボリュームバーの位置、サイズ、スタイルを変更できます。
- 価格接触のアラート: 価格がPOC、VAH、VALラインに触れた際に通知を受け取れます。
- cBot連携: アラートに基づいてcBotの開始または停止が可能です。
- ポジション管理: アラート発生時にポジションをクローズでき、各ライン(POC、VAH、VAL)ごとにカスタマイズ可能なオプションがあります。
- アラート方法: 音声、cTraderポップアップ、Telegramメッセージ(スクリーンショット付きオプションあり)、メールでアラートを受け取れます。
- パフォーマンス最適化: チャートに表示されていない過去の範囲を自動削除するオプションでパフォーマンスを向上させます。
- グローバルアラート制御: このインジケーターのすべてのアラートを簡単に有効または無効にできます。
- ユーザーガイド:チャート上の小さなボタンからこのインジケーターのユーザーガイドを簡単に開くことができます。
概要
The indicator offers two visualization modes: total volume or separate up and down volume bars. It features customizable settings for the number of volume levels, data resolution (Precise or Fast), and value area size. Magnetic ranges automatically update based on the latest candle to keep analysis current. Users can expand or contract POC, VAH, and VAL lines infinitely.
Alerts can be configured for price touches on these key levels, with notifications via sound, platform pop-ups, Telegram (including optional screenshots), and email. Alerts can trigger actions such as starting/stopping cBots or closing positions. The indicator also supports customizable appearance, performance optimization by auto-deleting out-of-view ranges, and global alert control. A user guide is accessible directly from the chart interface.
カスタマーレビュー
5 | 67 % | |
4 | 0 % | |
3 | 33 % | |
2 | 0 % | |
1 | 0 % |


