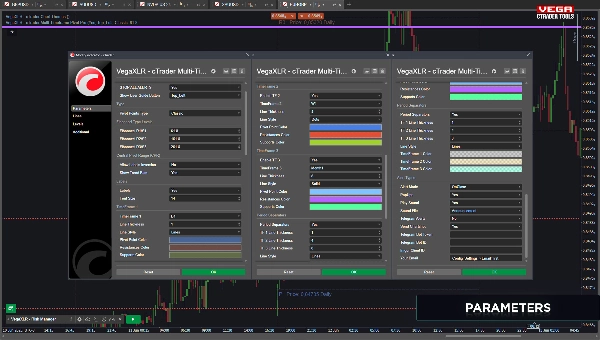
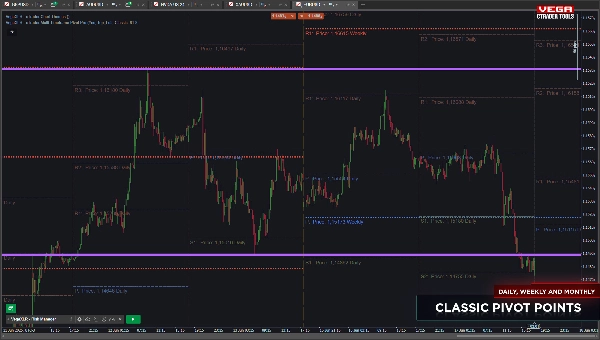
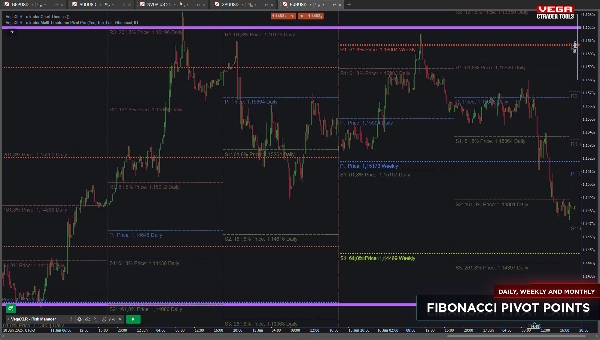
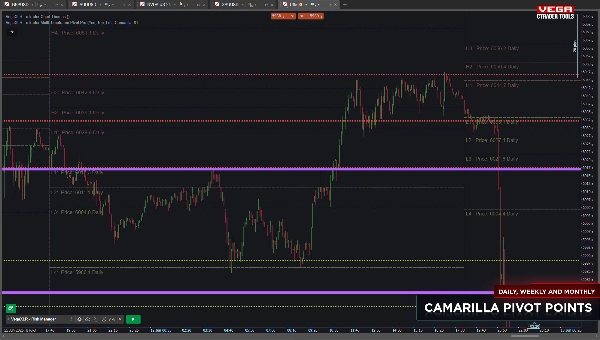
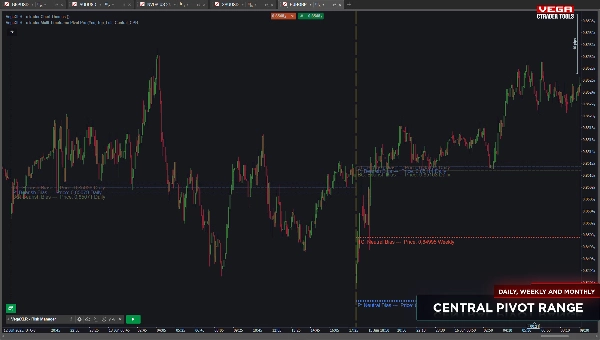
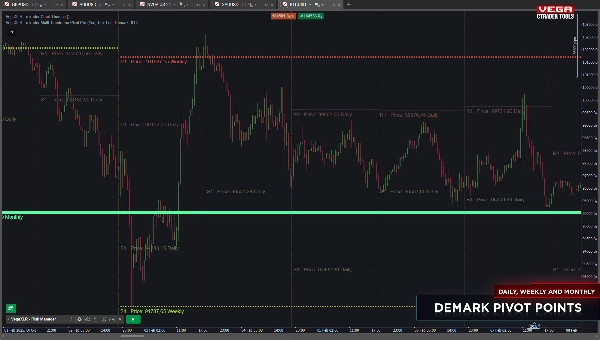
VegaXLR - cTrader Multi-Timeframe Pivot Pro
「VegaXLR - cTrader Multi-Timeframe Pivot Pro」ロゴ
5.0
08/09/2025
6
Desktop
「VegaXLR - cTrader Multi-Timeframe Pivot Pro」アップロード画像「VegaXLR - cTrader Multi-Timeframe Pivot Pro」アップロード画像「VegaXLR - cTrader Multi-Timeframe Pivot Pro」アップロード画像「VegaXLR - cTrader Multi-Timeframe Pivot Pro」アップロード画像「VegaXLR - cTrader Multi-Timeframe Pivot Pro」アップロード画像「VegaXLR - cTrader Multi-Timeframe Pivot Pro」アップロード画像

The cTrader Multi-Timeframe Pivot Pro is a highly customizable and feature-rich pivot point indicator for cTrader. It allows you to display pivot points for up to three timeframes of your choice, selecting from any timeframe available on the platform. The indicator supports multiple pivot styles, including Classic, Fibonacci, Demark, Camarilla, and Central Pivot Range (CPR), making it suitable for various trading strategies.

You can fully customize the labels, font sizes, colors, and pivot levels for all timeframes. For Fibonacci pivots, you can choose up to three levels (default: 61.8, 161.8, 261.8) along with the fixed 0% central pivot level. The CPR mode offers options like trend bias labels and inversion settings for added functionality.

Additional features include period separators to clearly mark trading periods and real-time alerts when the price interacts with pivot levels. Alerts can be sent via cTrader pop-ups, Telegram (with optional chart screenshots), or email, ensuring you never miss important price movements.

This indicator is ideal for traders looking for precision, flexibility, and advanced tools to enhance their technical analysis.


Here is a comprehensive list of features for the cTrader Multi-Timeframe Pivot Pro indicator:

  1. Multi-Timeframe Support:
    • Display pivot points for up to three customizable timeframes.
    • Choose from any timeframe available on the cTrader platform.
  2. Multiple Pivot Styles:
    • Classic
    • Fibonacci (with up to three levels: default 61.8, 161.8, 261.8)
    • Demark
    • Camarilla
    • Central Pivot Range (CPR) with trend bias labels and inversion settings.
  3. Customizable Appearance:
    • Fully adjustable label colors and font sizes.
    • Customizable pivot levels and styles for each timeframe.
  4. Real-Time Alerts:
    • Alerts triggered when the price interacts with any pivot level.
    • Notifications via cTrader pop-ups.
    • Telegram Alerts with chart screenshots.
    • Email notifications.
  5. Period Separators:
    • Clearly mark the start and end of trading periods on the chart.
  6. Enhanced Trading Analysis:
    • Provides key price levels for better trading decisions.
    • Supports various trading strategies with flexible pivot styles.

These features make the cTrader Multi-Timeframe Pivot Pro a versatile and powerful tool for traders looking to enhance their technical analysis and trading precision.

5.0
レビュー: 1
5
100 %
4
0 %
3
0 %
2
0 %
1
0 %
カスタマーレビュー
June 25, 2025
Velice prospěšný pomocník, je dobré používat jako doplněk k jinému indikátoru.
この作成者の他の商品
VegaXLR cTrader Toolbox
Centralized access to VegaXLR's cBots, indicators, and educational content in cTrader.
VegaXLR - Fixed Range Volume Profile
Identify key support and resistance levels through detailed volume distribution analysis.
インジケーター
Indices
Prop
Stocks
+3
VegaXLR - cTrader Chart Themes
Free chart themes for the cTrader platform.
インジケーター
Indices
Prop
Stocks
+3
VegaXLR - Unlimited Trendline Alerts
This is an indicator that can alert you about trendlines, horizontal lines and vertical lines.
cBot
Indices
Stocks
Forex
+2
VegaXLR - Risk Manager
Automate lot sizing with cTrader Risk Manager cBot for precise risk management in pending and market orders.
VegaXLR - Chart Patterns Alerts
Enhance your trading strategy with automated detection and alerts for key chart patterns.
VegaXLR - ZigZag Alerts
cTrader ZigZag Alerts: Precision Swing Detection, Alerts, and Fibonacci.
インジケーター
Indices
Stocks
Forex
+1
VegaXLR - Moving Average Alerts
A powerful cTrader indicator with customizable Moving Average alerts, notifications, and automated trading actions.
VegaXLR - Candlestick Patterns Alerts
Real-Time Candlestick Pattern Detection with Custom Alerts & Trend Analysis for cTrader
cBot
RSI
VegaXLR - cTrader Account Protector
This is an advanced tool designed to protect your trading account by managing drawdown and run-up levels.
VegaXLR - RSI and StochRSI Alerts
VegaXLR's cTrader StochRSI identifies overbought/oversold RSI levels for precise trade entries.
VegaXLR - Auto Support and Resistance
cTrader Auto Support & Resistance detects key levels with Fibonacci analysis and sends real-time trading alerts.
VegaXLR - Candlestick Patterns Pro
Identify 34 candlestick patterns, track trends across timeframes, and get instant alerts with this powerful trading tool
VegaXLR - Market Sessions Alerts
The cTrader Market Sessions Alerts Indicator marks global sessions, highlights key levels, and sends real-time alerts.
cBot
Forex
VegaXLR - Fibonacci Trading cBot
Automate Fibonacci trading with this cTrader cBot—advanced risk management, alerts, and seamless order execution.
VegaXLR - Bar Close Alert Manager
Bar Close Alert Manager provides real-time alerts for bar closures with customizable notifications and automation.
インジケーター
Indices
Breakout
Stocks
+2
VegaXLR - cTrader Pitchfork & Channel Enhancer
Enhance Pitchfork & Price Channels in cTrader with customizable Equidistant and Fibonacci levels.
cBot
Indices
Stocks
Commodities
+2
VegaXLR - Trendline Trading cBot
This is a cBot that will detect trendlines on the chart and open trades when the price interacts with them.
これも好きかも
インジケーター
NAS100
RSI
NZDUSD
+15
Inside Candle
Highlight market consolidation zones instantly with this Inside Candle indicator — precise, clean, and powerful.
インジケーター
Breakout
Forex
Signal
+2
MACD Plus
A visually enhanced MACD with colored histograms to clearly show trend strength.
インジケーター
Indices
XAUUSD
Breakout
+5
cAlgoBuddy - ADX Divergences
This cTrader ADX Divergence indicator is used to quantify trend strength divergences in a very profitable way.
インジケーター
RSI
Breakout
XAUUSD
+5
Zones Supply Demand
📊Zones Supply & Demand: Identifies key price levels with high volume concentration, marking Supply/Demand Zones & Marke
インジケーター
NAS100
NZDUSD
RSI
+18
Market Cipher A
Market Cipher A
IR Ichimoku Macd
this indicaotr show distance between Tenkan to Kijun, Close to Kijun and Close to Tenkan 
zh-cn Variety Period time panel(multilanguage)
This indicator can be used to: change color, shape size, position, change font, increase or decrease, and other function
インジケーター
RSI
Breakout
XAUUSD
+5
Dynamic Range MomentumI
This histogram helps visualize the strength and direction of market movements, making it easier to spot potential trends
BreakOut_Probability_Expo
Break Out Probability Experimental indicator. Credits for this indicator goes to Zeiierman !!!
IR VLine
don't move to the end of chart after timeframe changing. it should be better to use for near history. for long history
IR Open Connector
This indicator connects the opening prices of higher timeframe candles (Daily, Weekly, Monthly, or
Fx4U.Multi TimeFrame Support & Resistance
Allow trader to visualize Support & Resistance across different timeframes,give trader an overview of the current market
インジケーター
NAS100
NZDUSD
XAUUSD
+10
Relative Moving Average
Bring the RMA to cTrader! This is the Relative Moving Average from TradingView.
TDI_Pro
Traders Dynamic Index (TDI) — Divergence Edition
ADXMultiframeIndicator
Multi-Timeframe ADX Trend Dots & Arrows
インジケーター
Indices
Commodities
Forex
Institutional FVG Zones MTF with Confluence
Professional Fair Value Gaps with multitimeframe spot on