
説明
cTrader用スーパー・トレンド・インジケーター
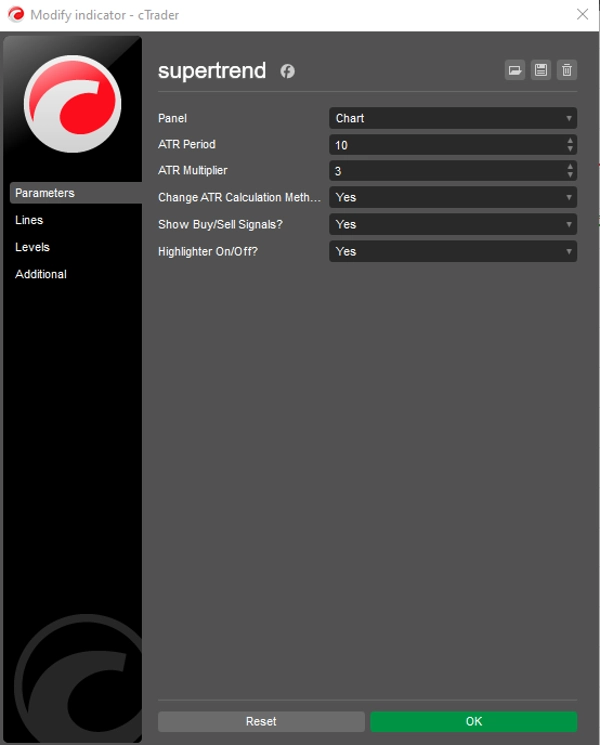
スーパー・トレンド・インジケーターは、市場のトレンドや潜在的なエントリー/エグジットポイントを簡単に特定するのに役立つ、強力で多用途なトレンド追従ツールです。cTraderプラットフォーム向けに作られており、このインジケーターは平均真の範囲(ATR)を活用して動的なサポートおよびレジスタンスレベルを計算し、強気および弱気のトレンドに対する明確な視覚的シグナルを提供します。そのシンプルさと効果的な機能により、スキャルパーから長期投資家まで、あらゆる経験レベルのトレーダーに愛用されています。
概要
AIによる概要
The Supertrend Indicator for cTrader is a trend-following tool that helps traders identify market trends and potential entry and exit points. It uses the Average True Range (ATR) to calculate dynamic support and resistance levels, providing clear visual signals for bullish and bearish trends. Designed for use on the cTrader platform, this indicator supports markets including Forex and indices. Its straightforward design makes it suitable for traders of various styles and experience levels, from scalpers to long-term investors. The indicator outputs trend strength signals based on bar data, aiding in market analysis without opening positions automatically.
インジケーターのプロフィール
インジケーターのカテゴリー
トレンド
出力の種類
シグナル
データ要件
バーのみ
サポート対象のシグナル
トレンドの強さ
カスタマーレビュー
4.3
レビュー: 3
5 | 67 % | |
4 | 0 % | |
3 | 33 % | |
2 | 0 % | |
1 | 0 % |
カスタマーレビュー
June 3, 2025
Practical entry check for traders who prefer directional setups. It gives value around trend filtering, but sideways markets can weaken the signal. The signal feels safer when trend strength is clear and DD stays under 3 percent. It is a filter for bias, not a reason to ignore risk.
June 2, 2025
June 2, 2025
Clean confirmation helper for trend filtering. it helps keep attention on the broader move, especially when used for filtering out random countertrend ideas. I would judge the trend read across 3 sessions, with at least 2 higher timeframe candles agreeing. It is a filter for bias, not a reason to ignore risk.
ディスカッション
よくあるご質問
Prop
Forex
Signal
Indices
Supertrend
ATR
cTrader Storeで入手可能な取引ボット、インジケーター、プラグインなどの商品は、第三者の開発者が提供するものであり、情報と技術の取得のみを目的としてご利用いただけます。cTrader Storeはブローカーではなく、投資助言や個人的な推奨を行うことも、将来のパフォーマンスを保証することもありません。


価格
登録日 30/05/2025
40
販売