
説明
🚀 チャネルブレイクアウトシステム
この 専門的なアルゴリズム は、複数のテクニカル分析要素を組み合わせて信頼できるシグナルを提供し、🎯 エントリーとエグジットポイントを正確に確認するよう設計されています。
🔍 仕組みは?
📊 ボラティリティベースのチャネル(ATR)
✅ 市場のボラティリティは ATR(平均真の範囲) 📉 を使って計算されます。
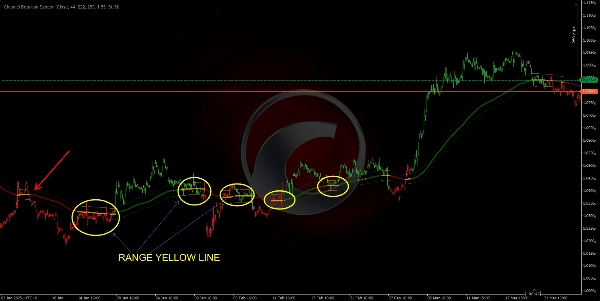
✅ 「トレンドMA」は、このボラティリティに比例した値を加減して調整され、2本の点線 が形成され、市場の 「天井」と「床」 として機能します。
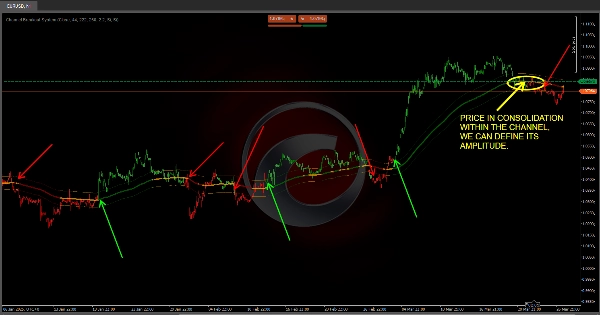
✅ これはあなたにとって何を意味するのか? 価格がチャネル内に留まる場合、市場はレンジまたは調整中である可能性があり、明確にブレイクアウトすれば、強いトレンドの動き のシグナルです 📈📉。
✅ 完全にカスタマイズ可能! チャネル設定を戦略に合わせて調整できます 📌。
🟢 スマートカラーによるトレンド検出
🔹 インジケーターは 高速MA と 中速MA の位置を比較し、両方を トレンドMA と関連付けます。
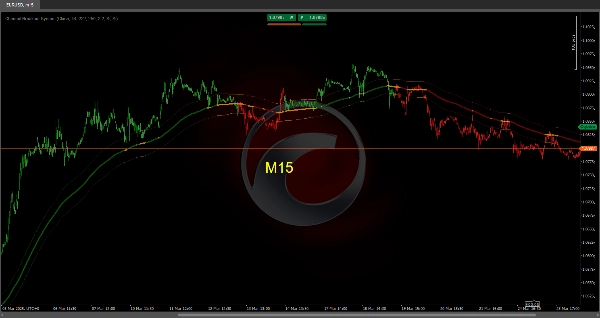
🔹 市場のフェーズに基づき、ローソク足の色が変わります:
- 🟢 緑 → 強気市場フェーズ。
- 🔴 赤 → 弱気市場フェーズ。
- 🟠 オレンジまたは中立 → 調整または不確実性の可能性。
🔹 価格と移動平均線がチャネル内に「はまっている」場合、それは 調整フェーズ のシグナルであり、迷いのあるゾーンでの取引を避けるのに役立ちます。
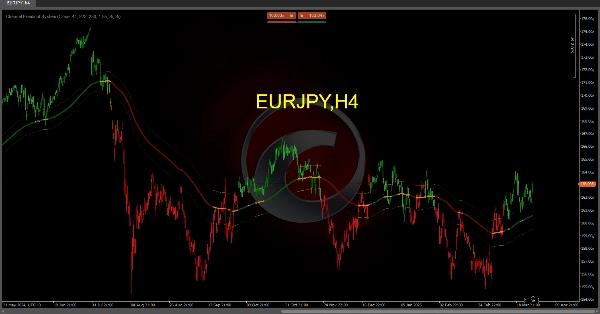
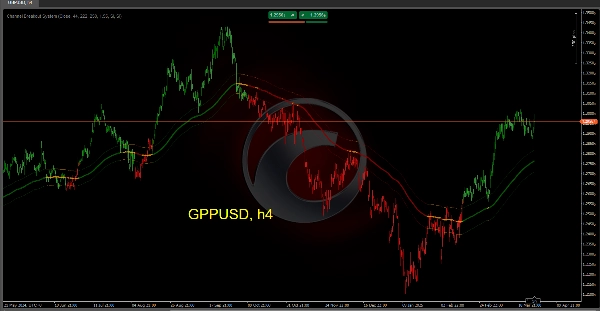
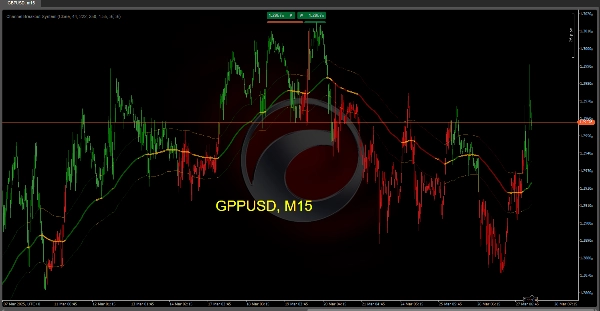
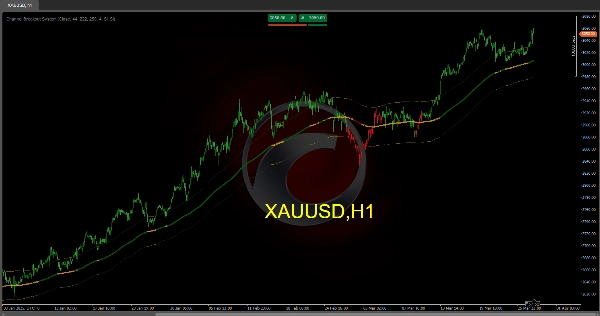
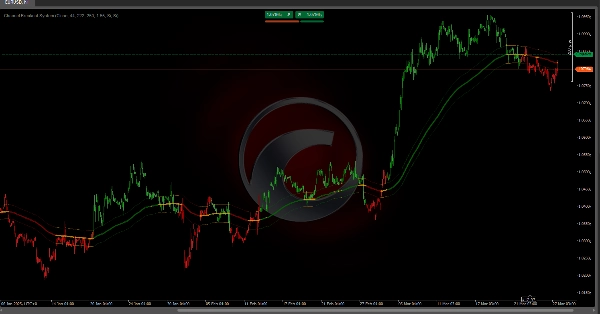
🎯 チャート上の見た目
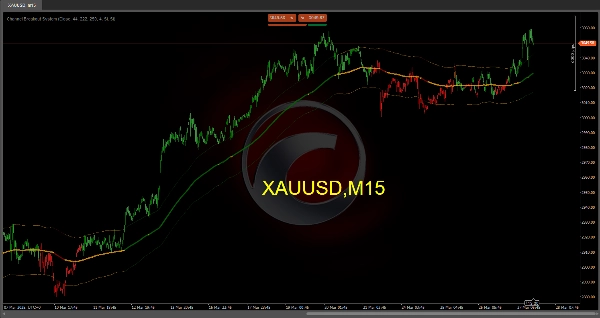
🔵 メイントレンドライン: 市場の方向に応じて色が変わります(緑、赤、またはオレンジ)。
📏 点線チャネル: ボラティリティに基づく市場のレンジを反映します。
📊 カラー付きバー: 現在の市場フェーズを視覚的に簡単に表現します。
🚀 なぜこのシステムを使うのか?
✔ 市場がトレンドかレンジかを素早く識別 します。
✔ トレンドの強さと方向を視覚的に強調 します。
✔ 明確なブレイクアウトとクロスオーバーシグナルで潜在的な反転を予測 します。
✔ エントリーとエグジットポイントを確認 し、誤ったシグナルを減らして取引の精度を向上させます。
🔹 チャネルブレイクアウトシステムを使って取引を最適化し、より自信を持って操作しましょう 🏆。最高の市場機会を見つける準備をしましょう! 📈🔥
Ctraderストアのインジケーター:
Dynamic Market Structure
Analysis of Turning Points
Fibonacci Linear
Regression Multi-timeframe
Multi-Level Candle Bias
Tracker
Auto Support and
Resistance Trend Lines
All Support and
Resistance Levels
概要
The system features smart color-coded trend detection by comparing fast, medium, and trend MAs, with candles changing color to indicate market phases: green for bullish, red for bearish, and orange for consolidation or uncertainty. This visual aid helps identify trend strength, direction, and potential consolidation zones.
On the chart, the main trend line changes color based on market direction, the dotted channel reflects volatility-based range, and colored bars provide an easy visual representation of the current market phase.
The indicator is fully customizable to fit different trading strategies. It aims to quickly identify trending or ranging markets, anticipate potential reversals with breakout and crossover signals, and confirm entry and exit points to reduce false signals and improve trade accuracy.
カスタマーレビュー
5 | 33 % | |
4 | 67 % | |
3 | 0 % | |
2 | 0 % | |
1 | 0 % |


![「[CB] Pivot Points Pro」ロゴ](https://cdn.ctrader.com/image/webp/43463c82-67b0-4f10-a4ba-901bba091d81_32594)


