
VegaXLR - Market Sessions Alerts
مؤشر
3 عمليات الشراء
الإصدار 1.0، Feb 2025
Windows, Mac
4.0
التقييمات: 1
الوصف
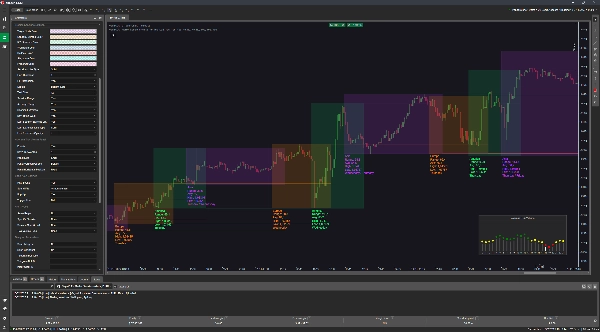
مؤشر تنبيهات جلسات سوق cTrader يساعد المتداولين عن طريق تمييز جلسات السوق ودمجها في مجموعات إقليمية: آسيا، أمريكا، وأوروبا. يقوم بتمديد أعلى وأدنى الجلسات لتسليط الضوء على مستويات الدعم والمقاومة الرئيسية، ويرسل تنبيهات عبر Telegram، البريد الإلكتروني، أو نوافذ منبثقة في cTrader عندما تصل الأسعار إلى هذه المستويات. بالإضافة إلى ذلك، يحتوي على لوحة تعرض متوسط حجم التيك لكل ساعة، مما يساعد في تحديد أوقات التداول المثلى.
الميزات:
- تسليط الضوء على جلسات السوق:
-
- تمييز الجلسات الفردية: طوكيو، لندن، نيويورك/أمريكا، ويلينغتون، سيدني، سنغافورة، فرانكفورت.
- دمج الجلسات في مجموعات إقليمية: آسيا، أوروبا، أمريكا.
- مستويات الدعم والمقاومة:
-
- تمديد أعلى وأدنى الجلسات لتحديد مستويات الدعم والمقاومة الرئيسية.
- تنبيهات قابلة للتخصيص:
-
- يرسل إشعارات عبر Telegram، البريد الإلكتروني، نوافذ منبثقة في cTrader، والصوت.
- أنواع التنبيهات تشمل:
-
- نفس المنطقة: ينبه عندما يلمس سعر الجلسة الحالية أقصى نقاط الجلسة السابقة في نفس المنطقة.
- جلسة محددة: ينبه عندما يلمس السعر أقصى نقاط جلسة ماضية مختارة.
- بداية ونهاية الجلسة: ينبه في بداية ونهاية الجلسات.
- نوع حجم التيك: ينبه عندما يصل متوسط حجم التيك إلى مستوى محدد.
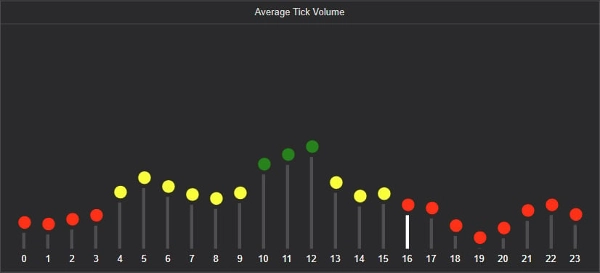
- لوحة متوسط حجم التيك:
-
- تعرض متوسط حجم التيك لكل ساعة على مدى عدد من الأيام يمكن تكوينه.
- تستخدم ترميزًا لونيًا للدلالة على مستويات الحجم: الأحمر (منخفض)، الأصفر (متوسط)، الأخضر (مرتفع).
- دليل المستخدم: يمكنك الوصول إلى دليل المستخدم لهذا المؤشر بالنقر على زر صغير على الرسم البياني.
تم تصميم هذا المؤشر لتعزيز استراتيجيات التداول من خلال توفير إشارات بصرية واضحة وتنبيهات في الوقت المناسب بناءً على ديناميكيات جلسات السوق.
الملخص
ملف تعريف المؤشر
تقييمات العملاء
4.0
التقييمات: 1
5 | 0 % | |
4 | 100 % | |
3 | 0 % | |
2 | 0 % | |
1 | 0 % |
تقييمات العملاء
مناقشة
الأسئلة الشائعة
Forex
يتم توفير المنتجات المتاحة من خلال cTrader Store، بما في ذلك روبوتات التداول والمؤشرات والإضافات، من قبل مطوري الطرف الثالث وإتاحتها لأغراض الوصول المعلوماتي والفني فقط. cTrader Store ليس وسيطًا ولا يقدم نصائح استثمارية أو توصيات شخصية أو أي ضمان للأداء المستقبلي.


السعر
232
المبيعات
696
التثبيتات المجانية