
الوصف
ما هو مؤشر خط الاتجاه؟
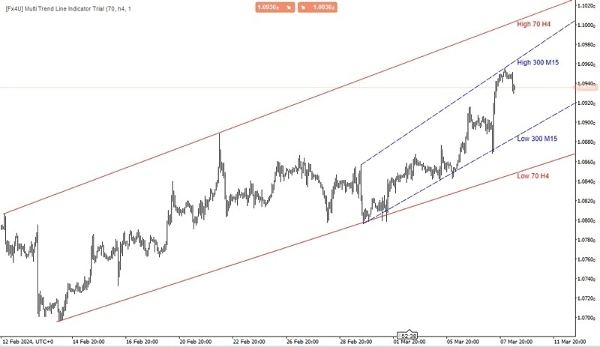
مؤشر خط الاتجاه هو أداة تحليل فني يستخدمها المتداولون والمحللون لتحديد اتجاه وقوة الاتجاه في سوق مالي. يعتمد على رسم خط مستقيم يربط بين نقطتي سعر أو أكثر على الرسم البياني. الهدف الأساسي من خط الاتجاه هو تمثيل الاتجاه العام لحركة السعر بصريًا خلال فترة زمنية محددة.
مؤشر خط الاتجاه متعدد الأطر الزمنية
الوظيفة الأساسية لمؤشر خط الاتجاه متعدد الأطر الزمنية هي تزويد المتداولين برؤية أوسع لاتجاهات السوق من خلال تجميع المعلومات من أطر زمنية مختلفة. من خلال تحليل الاتجاهات عبر أطر زمنية متعددة، يمكن للمتداولين اتخاذ قرارات أكثر وعيًا بشأن نقاط الدخول والخروج المحتملة، بالإضافة إلى الاتجاه العام للسوق.
عادةً ما يسمح هذا النوع من المؤشرات للمتداولين بتخصيص الأطر الزمنية التي يرغبون في تحليلها ورسم خطوط الاتجاه وفقًا لذلك. يمكن أن يكون أداة قيمة لتحديد مستويات الدعم والمقاومة الرئيسية، وانعكاسات الاتجاه، واستمرارية الاتجاه عبر أطر زمنية مختلفة، مما يساعد المتداولين على اتخاذ قرارات تداول أكثر دقة.
هناك عدة أنواع من خطوط الاتجاه، بما في ذلك:
- خط الاتجاه الصاعد: يتم رسمه عن طريق ربط نقطتي قاع أو أكثر متتاليتين على مخطط السعر. يشير إلى اتجاه صاعد، مما يدل على أن الأسعار ترتفع عمومًا مع مرور الوقت.
- خط الاتجاه الهابط: على العكس، يتم رسم خط الاتجاه الهابط عن طريق ربط نقطتي قمة أو أكثر متتاليتين على مخطط السعر. يشير إلى اتجاه هابط، مما يدل على أن الأسعار تنخفض عمومًا مع مرور الوقت.
- خط الاتجاه الأفقي: المعروف أيضًا بخطوط الدعم أو المقاومة، يتم رسمها أفقيًا للدلالة على المناطق التي تميل حركة السعر إلى التوقف أو الانعكاس فيها.
غالبًا ما يستخدم المتداولون خطوط الاتجاه جنبًا إلى جنب مع مؤشرات فنية أخرى وطرق تحليل لاتخاذ قرارات تداول مستنيرة. عندما يتم كسر أو اختراق خط الاتجاه، قد يشير ذلك إلى تغيير محتمل في اتجاه الاتجاه، مما يوفر إشارات تداول للمستثمرين.
منتجاتي الأخرى:
https://ctrader.com/products/346
https://ctrader.com/products/336
https://ctrader.com/products/343
https://ctrader.com/products/347
https://ctrader.com/products/148
الملخص
تقييمات العملاء
5 | 67 % | |
4 | 0 % | |
3 | 33 % | |
2 | 0 % | |
1 | 0 % |
![شعار "[Fx4U] GBPUSD - Price Action"](https://cdn.ctrader.com/image/webp/d80b34fc-da3c-4f01-a321-456450665649_26190)

![شعار "[Fx4U] CADJPY - Price Action"](https://cdn.ctrader.com/image/webp/1ba81247-b6b7-4f3c-a297-fa3eb1d57fe1_26195)

![شعار "[Fx4U] AUDCHF - Price Action"](https://cdn.ctrader.com/image/webp/0a22e9aa-c83b-42cd-b0b8-c1a2da593207_26148)

![شعار "[Fx4U] EURAUD - Price Action"](https://cdn.ctrader.com/image/webp/baf8dde4-1ef3-4beb-8ae2-0fed8320f65d_26177)


