
VA Footprint
مؤشر
2 عمليات الشراء
الإصدار 2.0، May 2026
Windows, Mac
4.5
التقييمات: 4
الوصف
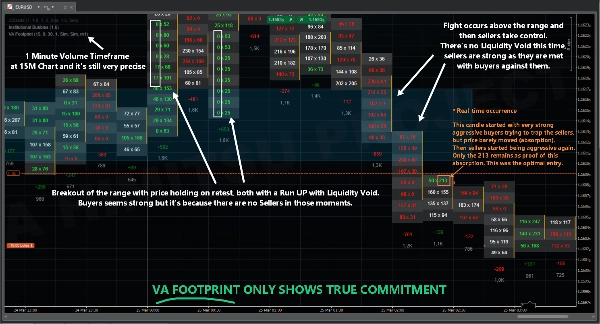
يقوم بصمة VA بتجميع العدوان حسب مجموعات التيك مما يلغي الحاجة إلى المراجعة المتقاطعة بين المستويات. توفر هذه البنية أيضًا مقاومة ضد التزييف عالي التردد (مثل التداول الوهمي أو الأوامر العدوانية المختلطة في الضوضاء، والتي تهدف إلى إخفاء النية عند مستوى العرض والطلب). نظرًا لأنه يقيس الالتزام عبر مجموعات من 10 تيكات أو أكثر، فمن الصعب والمكلف للنشاط المؤسسي إخفاء بصماتهم.
المعلمات القابلة للتعديل (الإعدادات ذات الصلة)
- مدة الصندوق (بالدقائق) --> اضبط لتتناسب مع الإطار الزمني للرسم البياني الخاص بك
- حجم المستوى (%)
- الوضع الداكن (true/false)
- عرض منطقة القيمة (true/false)
- الإطار الزمني للحجم (10-تيكات، 50-تيكات)
الاعتبارات المهمة
- إعادة تشغيل السوق بدقة التيك تعمل، يمكنك استخدام ذلك لاختبار استراتيجيتك واختبار المؤشر لفترات أطول.
- زيادة مستوى التيك تضيف دقة، تقليلها كثيرًا سيقلل من الدقة، على الأقل 0.10 يُنصح به.
الملخص
ملخص الذكاء الاصطناعي
VA Footprint is an order flow indicator that replaces traditional charts with a detailed footprint view, enabling precise market reading. It groups aggressive trading activity by clusters of ticks (typically 10 or more), reducing the need to cross-reference price levels and providing resilience against high-frequency trading spoofing tactics such as wash trading or disguised aggressive orders. This clustering approach makes it difficult for institutional activity to conceal their market footprints.
Key adjustable parameters include box duration (to align with chart timeframe), level size percentage, dark mode toggle, value area display, and volume timeframe selection (e.g., 10-tick or 50-tick clusters). The indicator supports market replay with tick precision, allowing users to backtest strategies over extended periods.
VA Footprint is applicable across multiple markets including Forex, indices, and stocks, and supports trading strategies such as scalping and smart money concepts. It provides visualizations, signals for divergences, breakouts, reversals, trend strength, volatility regimes, and level breaks, relying on tick data, bars, and volume inputs. This tool is designed to enhance market structure analysis and order flow understanding for traders.
ملف تعريف المؤشر
فئة المؤشر
تدفق الأوامر/DOM
نوع المخرجات
التصور
الإشارات
فلتر
متطلبات البيانات
بيانات التيك
أعمدة السعر فقط
الحجم
الإشارات المدعومة
التباين
الانقطاع
الانعكاس
قوة الاتجاه
التقلب
كسر المستوى
تقييمات العملاء
4.5
التقييمات: 4
5 | 50 % | |
4 | 50 % | |
3 | 0 % | |
2 | 0 % | |
1 | 0 % |
تقييمات العملاء
April 10, 2026
A decent setup here should survive 1 percent risk without looking messy. The first month should show both ROI and DD. The next review on it on 30 trades.
April 4, 2026
For risk management, this feels more useful as a filter than a full system. The journal should cover 76 setups and the trade context.
April 4, 2026
The stats tell the story. Tracking 1 percent risk first, compare the result with BE after 1R, and only scale if 1.5R partials still looks controlled.
March 31, 2026
Feels right for a user who wants less noise in the process. The best use is sizing and stop planning, then leaving the final filter manual. The problem appears when the tool makes weak ideas look acceptable.5R partials.
مناقشة
الأسئلة الشائعة
Prop
Forex
Scalping
Indices
SMC
Stocks
Market Structure
يتم توفير المنتجات المتاحة من خلال cTrader Store، بما في ذلك روبوتات التداول والمؤشرات والإضافات، من قبل مطوري الطرف الثالث وإتاحتها لأغراض الوصول المعلوماتي والفني فقط. cTrader Store ليس وسيطًا ولا يقدم نصائح استثمارية أو توصيات شخصية أو أي ضمان للأداء المستقبلي.


![شعار "[Stellar Strategies] MARSI Signal Plotter"](https://cdn.ctrader.com/image/webp/7b2b8da6-8f8e-4646-8d4a-4710c516c01e_25567)

السعر
منذ 24/03/2026
10
المبيعات
64
التثبيتات المجانية