
الوصف
مجموعة الشموع النهائية هنا لمساعدتك في اكتشاف معظم أنماط الشموع التي توجد اليوم.
أنماط الشموع، التي هي أدوات تداول فنية، تم استخدامها لقرون للتنبؤ باتجاه السعر. هناك أنماط شمعية مختلفة تُستخدم لتحديد اتجاه السعر والزخم، بما في ذلك ثلاث ضربات خطية، فجوتان حمراوان، ثلاث غربان حمراء، نجمة المساء، والطفل المهجور.
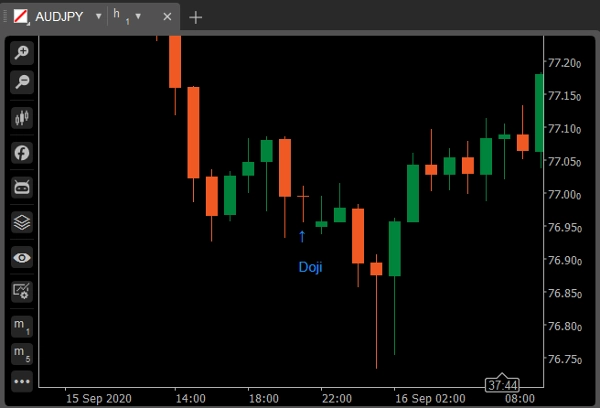
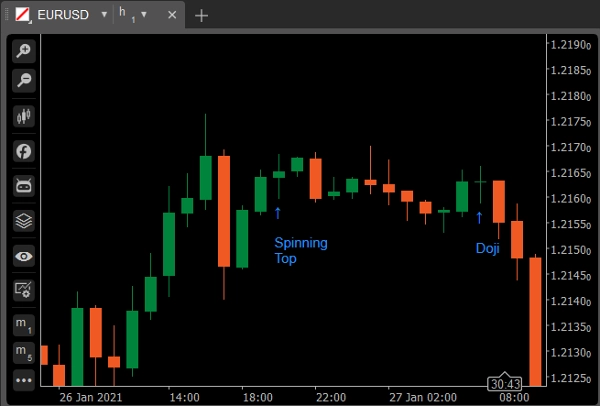
دوجي
تتشكل شمعة الدوجي عندما يكون فتح وإغلاق الأصل متساويين تقريبًا خلال الفترة الزمنية المحددة وعادة ما تشير إلى نمط انعكاس للمحللين الفنيين. عتبة الجسم هي بحد أقصى 5% من الطول الكلي.
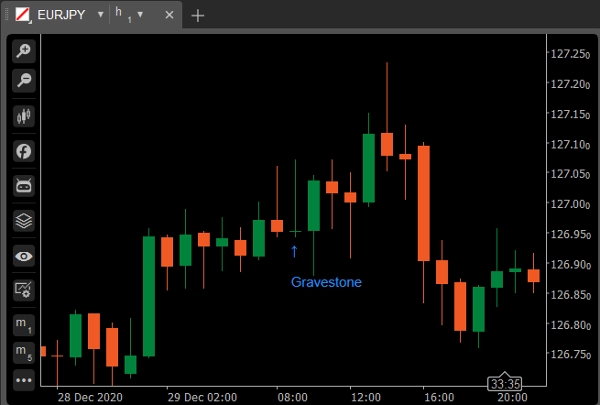
الاختلاف: دوجي حجر القبر
يتشكل عندما تكون أسعار الأعلى والفتح والإغلاق للأصل (تقريبًا) متساوية. الظل السفلي الطويل يشير إلى وجود بيع مكثف خلال فترة الشمعة، ولكن بما أن السعر أغلق بالقرب من الفتح فهذا يدل على أن المشترين تمكنوا من امتصاص البيع ودفع السعر للارتفاع مرة أخرى.
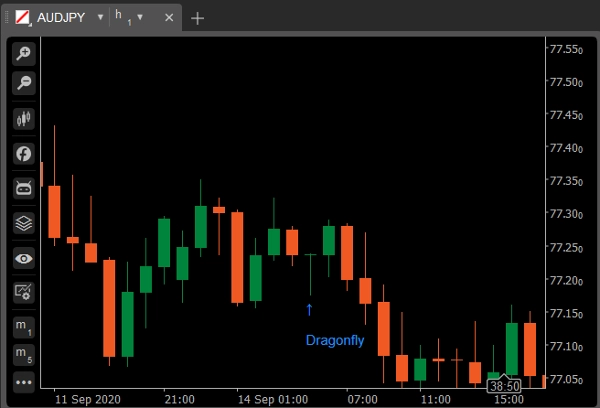
الاختلاف: دوجي اليعسوب
يحدث دوجي حجر القبر عندما تكون الأسعار الأدنى والفتح والإغلاق (تقريبًا) متساوية، والشمعة لها ظل علوي طويل. شكل حجر القبر يشبه الحرف "T" المقلوب. الدلالات لحجر القبر هي نفسها دوجي اليعسوب. كلاهما يشير إلى احتمالية انعكاس الاتجاه ولكن يجب تأكيده بواسطة الشمعة التالية.
القمة الدوارة
القمة الدوارة هي نمط شمعة له جسم حقيقي قصير يقع عموديًا في المنتصف بين ظلال علوية وسفلية طويلة. نمط الشمعة يمثل التردد بشأن الاتجاه المستقبلي للأصل. لا المشترون ولا البائعون تمكنوا من السيطرة. عتبة الجسم هي بحد أقصى 20% من الطول الكلي.
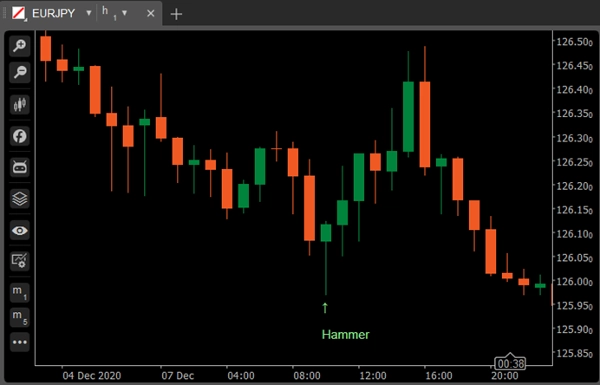
المطرقة
شمعة خضراء أو حمراء تتكون من جسم صغير بالقرب من الأعلى مع ظل علوي قليل أو معدوم وذيل سفلي طويل. تعتبر نمطًا صعوديًا خلال اتجاه هابط.
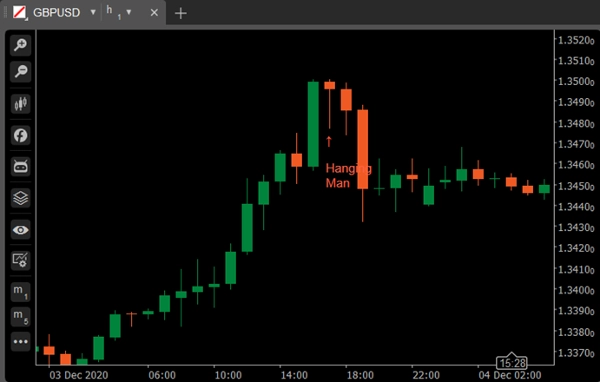
الاختلاف: الرجل المشنوق
شمعة خضراء أو حمراء تتكون من جسم صغير بالقرب من الأعلى مع ظل علوي قليل أو معدوم وذيل سفلي طويل. تعتبر نمطًا هبوطيًا خلال اتجاه صاعد.
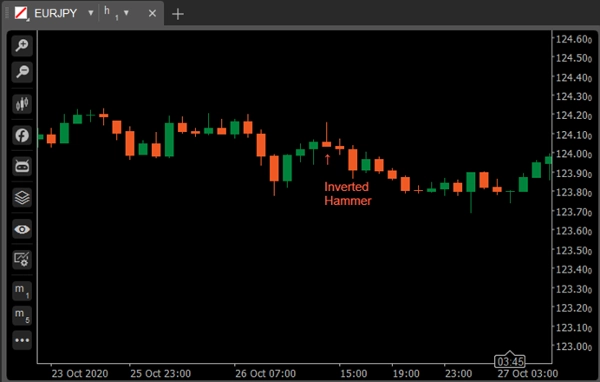
المطرقة المقلوبة
المطرقة المقلوبة هي نوع من نمط الشمعة يُوجد بعد اتجاه هابط وعادة ما يُعتبر إشارة انعكاس للاتجاه.
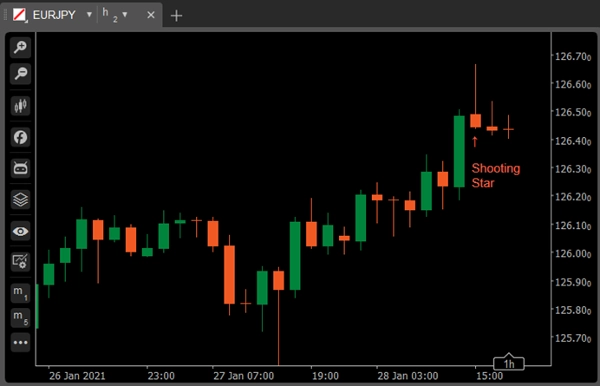
الاختلاف: نجمة مطلقة
نجمة مطلقة تبدو تمامًا مثل المطرقة المقلوبة، ولكن بدلاً من وجودها في اتجاه هابط، توجد في اتجاه صاعد وبالتالي لها دلالات مختلفة.
ماروبوزو
شمعة طويلة أو عادية (حمراء أو خضراء) بدون ظل أو ذيل. الأعلى والأدنى يمثلان أسعار الافتتاح والإغلاق. تعتبر نمط استمرار.
الاختلاف: ماروبوزو مفتوحة
بالنسبة لماروبوزو المفتوحة، يجب أن يكون سعر الافتتاح مستويًا: أي يجب أن يتحرك السعر في اتجاه واحد فقط، ولكن على عكس شمعة ماروبوزو الكاملة، يمكن أن يختلف سعر الإغلاق على الجانب الآخر قليلاً عن الأعلى/الأدنى. بمعنى آخر، يجب أن يكون الافتتاح مستويًا، مع وجود مجال لظل قصير على الجانب الآخر.
الاختلاف: ماروبوزو مغلقة
شمعة ماروبوزو المغلقة هي عكس ماروبوزو المفتوحة: يجب أن يكون الإغلاق مستويًا بينما يمكن أن يتحرك السعر قليلاً في الاتجاه الآخر قبل أن يبدأ التداول بقوة في اتجاه واحد.
الابتلاع الصعودي
يتكون من جسم أحمر أصغر يحتويه شمعة خضراء كبيرة تليها. عندما يظهر في القاع يُفسر كإشارة انعكاس رئيسية.
الابتلاع الهبوطي
يتكون من جسم أخضر أصغر يحتويه شمعة حمراء كبيرة تليها. عندما يظهر في القمة يُعتبر إشارة انعكاس رئيسية.
خط الاختراق
يتكون خط الاختراق من شمعة حمراء تليها شمعة خضراء تفتح أقل من أدنى سعر للشمعة السابقة لكنها تغلق أكثر من منتصف جسم الشمعة الحمراء. يُعتبر إشارة انعكاس عندما يظهر في القاع.
تغطية الظل الداكن
تتكون من شمعة خضراء طويلة تليها شمعة حمراء تفتح فوق أعلى سعر للشمعة الخضراء وتغلق جيدًا داخل جسم الشمعة الخضراء. تُعتبر إشارة انعكاس هبوطية خلال اتجاه صاعد.
هارامي صعودي
يتكون من جسم أحمر كبير بشكل غير عادي يتبعه جسم أخضر صغير (محتوى داخل الجسم الأحمر الكبير). يُعتبر نمطًا صعوديًا عندما يسبقه اتجاه هابط.
الاختلاف: هارامي صعودي متقاطع
جسم أحمر كبير يتبعه دوجي. يُعتبر إشارة انعكاس عندما يظهر في القاع.
هارامي هبوطي
يتكون هارامي هبوطي من جسم أخضر كبير بشكل غير عادي يتبعه جسم أحمر صغير (محتوى داخل الجسم الأخضر الكبير). يُعتبر نمطًا هبوطيًا عندما يسبقه اتجاه صاعد.
الاختلاف: هارامي هبوطي متقاطع
جسم أخضر كبير يتبعه دوجي. يُعتبر إشارة انعكاس عندما يظهر في القمة.
الركلة الصعودية/الهبوطية
إشارة الركلة الصعودية غالبًا ما تحدث بعد مفاجأة كبيرة في الأخبار تُعلن قبل أو بعد ساعات السوق. حدث شيء جذري، مما تسبب في تحول كبير في معنويات المستثمرين، وسيتبع ذلك انعكاس حتمي. كلما زادت الفجوة بين الشمعتين، كانت الإشارة أكثر أهمية.
نجمة الصباح/المساء
تتكون من شمعة خضراء كبيرة يتبعها شمعة صغيرة (حمراء أو خضراء) تفصل بينها فجوة فوق السابقة. الثالثة هي شمعة حمراء تغلق جيدًا داخل الجسم الأخضر الكبير. تُعتبر إشارة انعكاس عندما تظهر عند المستوى الأعلى.
الاختلاف: الطفل المهجور
ثلاثة جنود خضر/ثلاث غربان حمراء
تتكون من ثلاث شموع خضراء طويلة مع إغلاقات متتالية أعلى. أسعار الإغلاق قريبة من أو عند أعلى مستوياتها. عندما تظهر في القاع تُفسر كإشارة انعكاس قاع.
تتكون من ثلاث شموع حمراء طويلة مع إغلاقات متتالية أدنى. أسعار الإغلاق قريبة من أو عند أدنى مستوياتها. عندما تظهر في القمة تُعتبر إشارة انعكاس قمة.
ثلاث ضربات خطية
ثلاث ضربات خطية هي مجموعة استمرار من الشموع تحتوي على ثلاث شموع في اتجاه الاتجاه تليها شمعة نهائية تعود إلى نقطة البداية. يستخدم المتداولون ثلاث ضربات خطية كفرصة للشراء عند أدنى مستوى للاتجاه الأخير أو البيع عند أعلى مستوى حديث.
فجوتان حمراوان
نمط استمرار هبوطي فجوتان حمراوان يظهر بعد قمة ملحوظة في اتجاه صاعد، مع فجوة هبوطية تؤدي إلى شريطين حمراوين يسجلان أدنى مستويات متتالية. يتوقع هذا النمط أن يستمر الانخفاض إلى مستويات أدنى حتى.
الملخص
تقييمات العملاء
5 | 100 % | |
4 | 0 % | |
3 | 0 % | |
2 | 0 % | |
1 | 0 % |


