
Description
Si le marché continue de se déplacer dans cette nouvelle direction, à un moment donné, le profit de la transaction dans la direction opposée dépassera la perte de la transaction initiale, moment auquel vous pourrez clôturer les deux transactions.
Si le marché revient à la direction précédente, la transaction opposée avec la taille de lot plus grande accumulera des pertes plus rapidement que la transaction initiale ne gagne. Dans cette situation, nous ouvrons une autre transaction dans la direction initiale par laquelle la transaction initiale et la troisième transaction ensemble seront plus grandes que la deuxième transaction.
Cette stratégie de couverture aller-retour peut être poursuivie jusqu'à ce que l'action des prix casse dans l'une ou l'autre direction.
Comment utiliser l'indicateur Zone Recovery
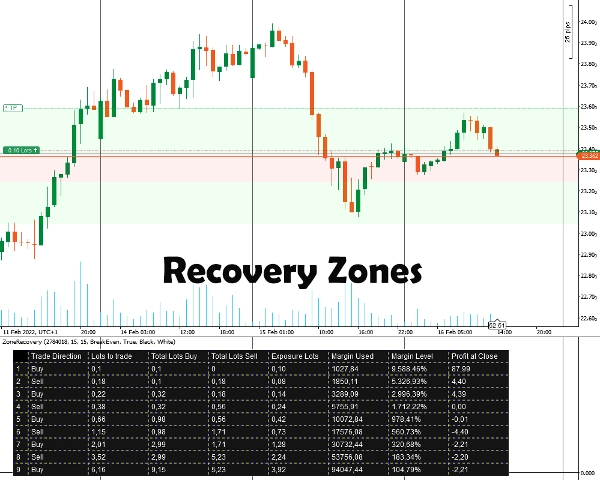
Tout d'abord, vous devez entrer l'ID de position que vous souhaitez couvrir. La position doit avoir un objectif de profit. Ensuite, vous sélectionnez la taille de Zone Recovery en entrant le nombre de pips à partir duquel vous pensez devoir commencer à couvrir. L'indicateur affichera les zones ainsi que le tableau pour que la stratégie fonctionne.
Vous devrez placer manuellement les ordres, les stops loss et les objectifs de take profit pour toutes les positions suivantes.
Informations importantes
Avant tout, votre compte de trading doit être un compte de type couverture.
- Fondamentalement, il s'agit d'une stratégie martingale qui comporte ses risques. Si la transaction initiale est ouverte dans un marché en range, cela peut rapidement épuiser votre marge. Vous avez besoin d'instruments volatils/tendance pour de meilleurs résultats.
- Les instruments de trading avec de faibles commissions/petits spreads fonctionneront mieux.
- Si la transaction initiale est effectuée avec la taille de lot minimale, les calculs suivants seront légèrement erronés, en raison de calculs incorrects des commissions et des tailles de lots arrondies pour les transactions futures.
- Si vous tradez un instrument différent de la devise de votre compte, le calcul de la marge sera légèrement décalé en raison des taux de change qui changent constamment. (Par exemple, compte en EUR, position ouverte en GBP/USD)
- Les swaps ne sont pas pris en compte.
Options de l'indicateur
L'indicateur offre les options suivantes :
- ID de position - L'ID de la position ouverte pour laquelle vous souhaitez calculer le tableau de couverture. Il peut être saisi sans le “PID” initial (juste les chiffres).
- Zone Recovery Pips - Le nombre de pips que la zone recovery prendra en compte pour les calculs. À la fin de la zone recovery, les transactions dans la direction opposée à la transaction initiale doivent être ouvertes.
- Mode de calcul
Deux modes sont disponibles : BreakEven et Profit
BreakEven : Les calculs tenteront de vous donner des tailles de lots afin d'avoir des pertes nulles ou minimales lorsque toutes les transactions sont clôturées. Drainage de marge plus lent.
Profit : Les calculs tenteront de vous donner des tailles de lots afin d'atteindre l'objectif de profit de la transaction initiale ouverte. Drainage de marge plus rapide. - Dessiner les zones de récupération - Choisissez oui si vous souhaitez que les zones de récupération soient dessinées sur le graphique.
- Couleur du tableau / Couleur de la police - Options de coloration pour le tableau de couverture.
Résumé
Avis clients
5 | 100 % | |
4 | 0 % | |
3 | 0 % | |
2 | 0 % | |
1 | 0 % |


![Logo de "[Stellar Strategies] Inside Bar with Signals"](https://cdn.ctrader.com/image/webp/1d9e8bfa-3b2c-4440-bb37-5856902008a7_30683)


