
Description
Le but de cet algorithme cTrader de l'indicateur Boxify est d'essayer de placer l'action des prix dans des zones, ou mieux, des boîtes. De cette façon, le trader peut obtenir un avantage sur ses positions de trading. Ce n'est pas un indicateur qui peut fonctionner seul, mais plutôt un bel outil qui peut compléter toute stratégie ou configuration de trading.
Détecter un mouvement latéral peut aider le trader à sécuriser ses profits, couper ses pertes ou placer des ordres limites en sa faveur. Voici quelques façons dont nous pouvons utiliser une boîte :
Détecter les zones de consolidation
Pour les boîtes passées contenant plusieurs barres à l'intérieur, nous pouvons supposer en toute sécurité qu'il s'agit de zones de consolidation et que nous avons un mouvement latéral. Ces zones peuvent servir de niveaux de support ou de résistance dans votre analyse de l'action des prix.
Mieux placer vos trades
Dans le cas où vous avez une configuration pour un trade et que vous voyez le prix dans une boîte, vous pouvez toujours utiliser la boîte comme guide pour l'action des prix, afin d'obtenir une position plus avantageuse pour votre trade. La boîte qui se forme actuellement peut être utilisée soit pour sécuriser certains profits dans une position gagnante, réintégrer un marché en tendance ou placer des stops de perte.
Placer des ordres limites
Le long mouvement latéral mènera finalement à des cassures. Boxify peut vous aider à placer des ordres limites, au-dessus ou en dessous, pour tirer le meilleur parti d'un début de cassure.
Options de l'indicateur
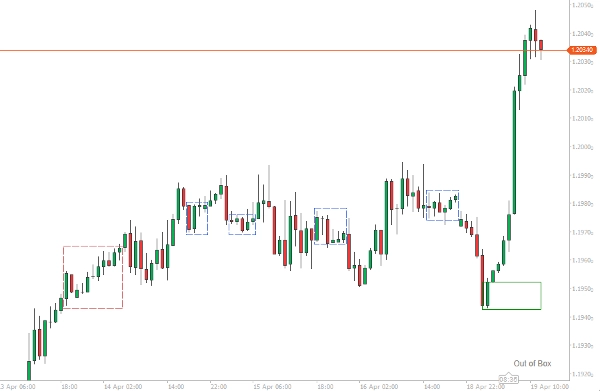
L'indicateur tentera de créer une boîte à partir d'au moins 2 barres et plus. Les messages de l'indicateur apparaîtront dans le coin inférieur droit de la zone du graphique.
- Si le prix est en tendance, le message « Out of Box » apparaîtra.
- Si le prix est dans une boîte, le message « Boxing » apparaîtra.
- Si le prix est dans une boîte et que le prix dépasse la limite supérieure, « Breaking High » apparaîtra.
- Si le prix est dans une boîte et que le prix dépasse la limite inférieure, « Breaking Low » apparaîtra.
Les boîtes sont considérées comme complètes à l'ouverture d'une nouvelle barre, car le prix peut toujours revenir dans la boîte.
Nombre minimum de barres pour une boîte
Ce nombre représente le nombre minimum de barres qu'une boîte doit contenir pour être considérée comme complète. Utilisez des nombres plus bas pour les points d'entrée, et des nombres plus élevés pour les zones de consolidation.
Filtre ATR
Boxify intègre un indicateur ATR, que vous pouvez utiliser comme option de filtrage, au cas où vous voudriez arrêter la formation de la boîte sur toute barre dont la longueur (Haut-Bas) dépasse la valeur ATR. Utilisez cette option si vous souhaitez entrer dans des trades.
Fusionner les chevauchements
Le début d'une boîte peut commencer avant la fin de la boîte précédente (surtout si nous avons sélectionné un nombre très bas pour la longueur de la boîte). Nous pouvons fusionner ces boîtes avec cette option, afin de voir une boîte plus grande se former – Ces boîtes auront une bordure de couleur bleue.
Tolérance
Un nombre qui reflète la tolérance que les limites supérieures/inférieures des boîtes peuvent avoir. De petits nombres doivent être utilisés lorsque nous voulons entrer dans des trades, des nombres plus grands doivent être utilisés lorsque nous voulons trouver des zones de consolidation.
Résumé
Avis clients
5 | 33 % | |
4 | 67 % | |
3 | 0 % | |
2 | 0 % | |
1 | 0 % |


