
Description
ZigzagSR – Oscillations Zigzag Dynamiques avec Support & Résistance Automatisés
Débloquez une structure de marché plus claire et des zones d'entrée précises avec ZigzagSR, un indicateur puissant pour cTrader qui :
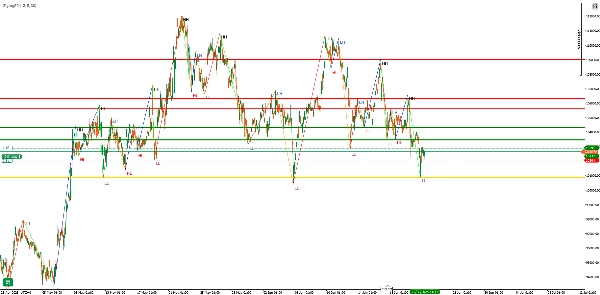
- Trace en temps réel des oscillations zigzag non-repeintes (plus hauts plus hauts, plus hauts plus bas, plus bas plus hauts, plus bas plus bas)
- Dessine automatiquement des niveaux dynamiques de support & résistance basés sur les oscillations pivots les plus récentes
- Étiquette chaque point d'oscillation (“HH”, “LH”, “HL”, “LL”) pour une clarté immédiate de la tendance
Caractéristiques principales
- Détection Zigzag Adaptative
-
- Paramètres configurables Depth, Deviation, et Backstep pour affiner la sensibilité au bruit du marché
- La logique non-repeinte garantit que les signaux historiques restent stables une fois tracés
- Niveaux SR Automatiques
-
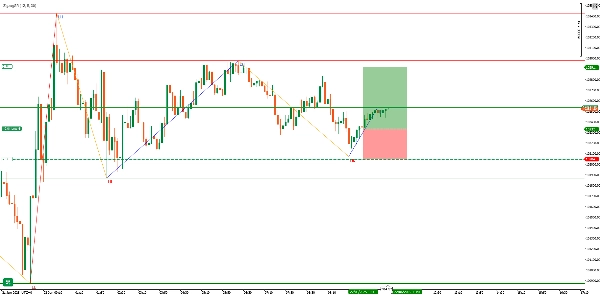
- Trace une ligne Pivot au dernier point d'oscillation valide (ligne dorée)
- Met en évidence jusqu'aux trois derniers plus hauts de Résistance (lignes rouges) et trois plus bas de Support (lignes vertes) avant le pivot
- Les lignes se mettent à jour de manière fluide au fur et à mesure que de nouvelles oscillations se forment, gardant votre graphique propre
- Étiquettes Visuelles Claires
-
- “HH” (Plus Haut Plus Haut) et “LH” (Plus Haut Plus Bas) pour les pics baissiers/plus hauts
- “HL” (Plus Bas Plus Haut) et “LL” (Plus Bas Plus Bas) pour les creux haussiers/plus bas
- Segments zigzag codés par couleur :
-
- HH → Vert citron
- LH → Orange
- HL → Bleu
- LL → Rouge
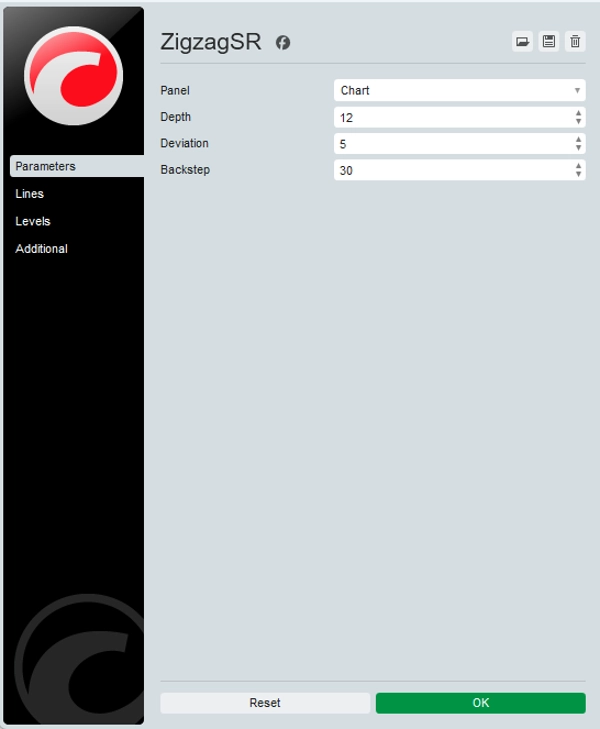
Entrées & Personnalisation
ParamètreDéfautDescription
Depth
12
Barres de recul pour identifier les plus hauts/bas locaux
Deviation
5
Mouvement de prix minimum (en ticks) pour compter comme une oscillation
Backstep
3
Barres à “rembobiner” pour supprimer les faux pivots
Astuce : Augmentez Depth & Deviation sur les unités de temps supérieures pour filtrer le bruit ; réduisez-les sur M1/M5 pour plus de sensibilité.
Pourquoi utiliser ZigzagSR ?
- Confirmation de Tendance : Distinguez clairement les oscillations impulsives des mouvements correctifs — idéal pour les traders de swing et de breakout.
- Zones d'Entrée SR : Les niveaux marqués automatiquement vous aident à cibler les zones d'entrée, stop-loss et take-profit sans tracer de lignes manuellement.
- Développement de Stratégie : Les étiquettes et lignes alimentent directement les EAs/cBots ou systèmes manuels — construisez des configurations cohérentes basées sur des règles.
Comment ça fonctionne
- Cartographie Haut/Bas
-
- Analyse les barres sur les
Depthdernières périodes pour repérer les extrêmes locaux (_highMap&_lowMap).
- Analyse les barres sur les
- Construction des Oscillations
-
- Alterne entre états haussier et baissier, ajoutant uniquement les pivots significatifs à la liste des oscillations.
- Attribution des Étiquettes
-
- Compare chaque pivot avec le précédent pour le taguer comme HH/LH ou HL/LL.
- Tracé SR
-
- Identifie le dernier pivot comme la “ligne pivot”, puis trace les trois derniers plus hauts et plus bas valides comme résistance/support.
- Rendu Zigzag
-
- Relie tous les points d'oscillation avec des lignes de tendance colorées et superpose des étiquettes de texte légèrement décalées pour plus de clarté.
Cas d'utilisation & Conseils
- Swing Trading : Profitez des impulsions multi-barres — entrez sur les replis vers la ligne pivot, ciblez le niveau SR suivant.
- Confirmation de Breakout : Attendez que le prix perce une ligne de résistance tracée par ZigzagSR, puis confirmez avec le volume ou le RSI.
- Superposition avec d'autres indicateurs : Combinez avec des moyennes mobiles, divergences RSI ou profils de volume pour renforcer les signaux.
Commencez en quelques secondes :
- Installez ZigzagSR depuis le cTrader Store.
- Glissez-le sur n'importe quel graphique — aucune bibliothèque externe requise.
- Ajustez les trois paramètres d'entrée selon votre unité de temps et style de stratégie préférés.
Améliorez votre analyse graphique avec une structure d'oscillation en temps réel et un support & résistance dynamiques — essayez ZigzagSR dès aujourd'hui !
Résumé
Avis clients
5 | 33 % | |
4 | 67 % | |
3 | 0 % | |
2 | 0 % | |
1 | 0 % |


![Logo de "[Hamster-Coder] Bollinger Bands"](https://cdn.ctrader.com/image/webp/21d8e5d6-fb11-4bac-b9ee-cd05c2b76804_30327)


