

Description
🧠 Indicateur RSI Avancé – Analyse de Momentum Précise
Obtenez une Compréhension Approfondie des Tendances du Marché avec un RSI Plus Intelligent
Le Indicateur RSI Avancé est une évolution puissante de l'outil RSI classique, développé pour les traders qui valorisent la précision et le filtrage intelligent des signaux. Grâce à un lissage algorithmique avancé, des zones adaptatives et une détection intégrée des divergences, cet outil offre une analyse affinée du momentum pour tous les marchés et toutes les périodes.
🔍 Caractéristiques Clés :
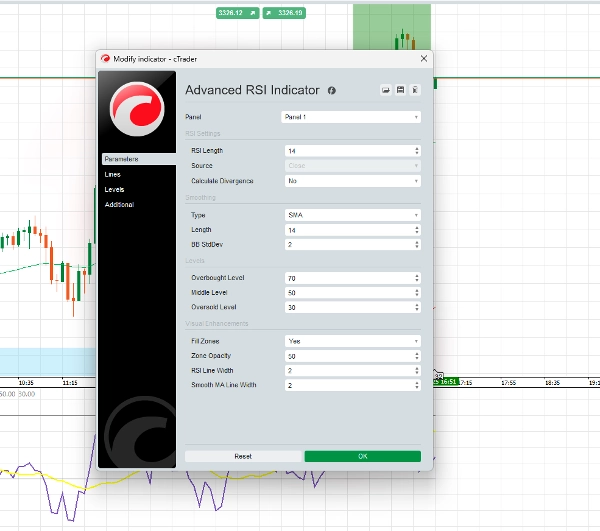
✅ Courbe RSI Lissée
Réduit les mouvements erratiques et les faux signaux pour une meilleure compréhension des tendances du marché.
✅ Zones de Signal Adaptatives
Va au-delà des niveaux traditionnels 70/30 avec des seuils dynamiques qui réagissent à la volatilité du marché.
✅ Zones de Momentum Codées par Couleur
Évaluez rapidement le momentum haussier ou baissier grâce à un design visuel intuitif.
✅ Alertes de Divergence
Met en évidence les configurations de divergence haussière et baissière pour soutenir la prise de décision stratégique.
✅ Système d'Alerte Personnalisé
Configurez des alertes pour les croisements de niveaux RSI et les signaux de divergence afin de ne jamais manquer les moments clés.
✅ Multi-Actifs, Multi-Temps
Optimisé pour une utilisation sur le forex, crypto, actions, indices, et plus encore — des graphiques M1 aux graphiques journaliers.
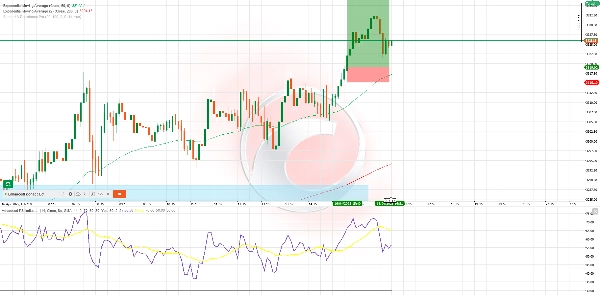
⚙️ Exemple de Stratégie – RSI Wave Ride
Idéal pour : trades swing H1 & H4
Indicateurs utilisés : RSI Avancé, 50 EMA, 200 EMA
Exemple d'Achat :
- Le prix est au-dessus des EMA 50 & 200
- Le RSI descend sous 40 puis commence à remonter
- Apparition de la couleur de momentum haussier
- (Optionnel) Divergence haussière détectée
- Entrée : clôture de la bougie au-dessus du signal
- SL : Sous le dernier creux
- TP : 1,5x–2x le risque ou la résistance récente
Exemple de Vente :
- Le prix est en dessous des EMA 50 & 200
- Le RSI dépasse 60, puis commence à baisser
- La couleur de momentum baissier confirme la direction
- (Optionnel) Divergence baissière renforce le signal
- Entrée : clôture de la bougie de confirmation
- SL : Au-dessus du dernier sommet
- TP : 1,5x–2x le risque ou le support récent
💬 Pourquoi les Traders Choisissent Cet Outil :
- Facile à utiliser, mais puissant
- Signaux non recalculés
- Testé sur les principaux marchés
- Peut être utilisé seul ou avec d'autres stratégies
Résumé
Avis clients
5 | 100 % | |
4 | 0 % | |
3 | 0 % | |
2 | 0 % | |
1 | 0 % |


